| Business / Exchange Rates |
CAD to CNY Exchange Rates:
(Canadian Dollar to Chinese Yuan Renminbi)
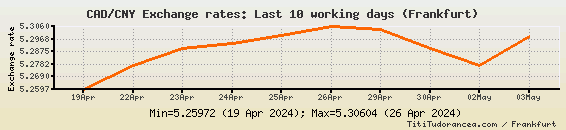
Last 10 working days
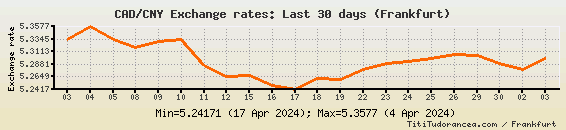
Last 30 days
Friday, April 19th: The CAD/CNY quote moved down, reaching the 5.25972 level.
Thursday, April 18th: A moderate gain brought the Canadian dollar to Chinese yuan quotation to the 5.26275 level.
Wednesday, April 17th: The rate hit 5.24171 Chinese yuan to the Canadian dollar, the lowest level in four months.
Tuesday, April 16th: The Canadian dollar started to depreciate again against the Chinese yuan, the quote going down by 0.01774.
Monday, April 15th: A 0.00202 addition brought the CAD/CNY exchange ![]() to 5.26692.
to 5.26692.
Friday, April 12th: A second consecutive decrease brought the ![]() to the 5.2649 level.
to the 5.2649 level.
Thursday, April 11th: The downward movement restarted, the pair dropping to 5.28636.
Tuesday, April 9th - Wednesday, April 10th: The exchange ![]() was up for two trading days in a row, reaching 5.33324.
was up for two trading days in a row, reaching 5.33324.
Monday, April 8th: The Canadian dollar to Chinese yuan quotation went down again. A 0.01416 loss brought the ![]() to 5.31988.
to 5.31988.
Friday, April 5th: The descending trend started again - the CAD/CNY currency pair went down to 5.33404.
Thursday, April 4th: A 0.02316 gain brought the Canadian dollar to Chinese yuan exchange ![]() to 5.3577, the highest level in eight weeks.
to 5.3577, the highest level in eight weeks.
Wednesday, April 3rd: The CAD/CNY cross declined slightly, to 5.33454.
Tuesday, April 2nd: The ![]() of exchange increased again, from 5.32606 to 5.33573.
of exchange increased again, from 5.32606 to 5.33573.
Thursday, March 28th: The Canadian dollar started to rise again against the Chinese currency; the CAD/CNY quotation was up 0.01189.
Wednesday, March 27th: The quotation moved down, reaching 5.31417.
Tuesday, March 26th: A moderate gain brought the Canadian dollar to Chinese yuan exchange ![]() to the 5.32396 level.
to the 5.32396 level.
Friday, March 22nd - Monday, March 25th: The exchange rate decreased for two trading days in a row, reaching 5.3073 Chinese yuan to the Canadian dollar on Monday, March 25th.
Wednesday, March 20th - Thursday, March 21st: The rate rose for two trading days in a row, reaching the level of 5.32845 Chinese yuan to the Canadian dollar on Thursday, March 21st.
Last 365 days
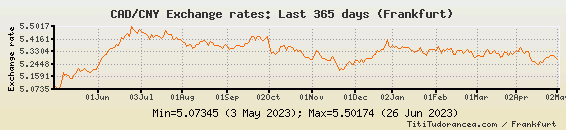
CAD/CNY Exchange rate - Historical data:
| Date: | Exchange rate: |
| 2024-04-19 | 5.25972 |
| 2024-04-18 | 5.26275 |
| 2024-04-17 | 5.24171 |
| 2024-04-16 | 5.24918 |
| 2024-04-15 | 5.26692 |
| 2024-04-12 | 5.2649 |
| 2024-04-11 | 5.28636 |
| 2024-04-10 | 5.33324 |
| 2024-04-09 | 5.32938 |
| 2024-04-08 | 5.31988 |
| 2024-04-05 | 5.33404 |
| 2024-04-04 | 5.3577 |
| 2024-04-03 | 5.33454 |
| 2024-04-02 | 5.33573 |
| 2024-03-28 | 5.32606 |
| 2024-03-27 | 5.31417 |
| 2024-03-26 | 5.32396 |
| 2024-03-25 | 5.3073 |
| 2024-03-22 | 5.32714 |
| 2024-03-21 | 5.32845 |
| 2024-03-20 | 5.2971 |
| 2024-03-19 | 5.29153 |
| 2024-03-18 | 5.31719 |
| 2024-03-15 | 5.32075 |
| 2024-03-14 | 5.33542 |
| 2024-03-13 | 5.33193 |
| 2024-03-12 | 5.31583 |
| 2024-03-11 | 5.31899 |
| 2024-03-08 | 5.34617 |
| 2024-03-07 | 5.33234 |
| 2024-03-06 | 5.3 |
| 2024-03-05 | 5.29626 |
| 2024-03-04 | 5.30498 |
| 2024-03-01 | 5.30261 |
| 2024-02-29 | 5.29166 |
| 2024-02-28 | 5.29696 |
| 2024-02-27 | 5.33379 |
| 2024-02-26 | 5.32234 |
| 2024-02-23 | 5.34531 |
| 2024-02-22 | 5.33507 |
| 2024-02-21 | 5.31742 |
| 2024-02-20 | 5.33704 |
| 2024-02-19 | 5.34155 |
| 2024-02-16 | 5.33551 |
| 2024-02-15 | 5.31299 |
| 2024-02-14 | 5.31153 |
| 2024-02-13 | 5.35049 |
| 2024-02-12 | 5.34315 |
| 2024-02-09 | 5.34923 |
| 2024-02-08 | 5.33747 |
| 2024-02-07 | 5.34646 |
| 2024-02-06 | 5.31674 |
| 2024-02-05 | 5.33191 |
| 2024-02-02 | 5.36624 |
| 2024-02-01 | 5.34021 |
| 2024-01-31 | 5.34339 |
| 2024-01-30 | 5.34647 |
| 2024-01-29 | 5.34328 |
| 2024-01-26 | 5.33949 |
| 2024-01-25 | 5.30739 |
| 2024-01-24 | 5.31706 |
| 2024-01-23 | 5.32175 |
| 2024-01-22 | 5.35903 |
| 2024-01-19 | 5.34191 |
| 2024-01-18 | 5.32872 |
| 2024-01-17 | 5.32358 |
The cross rates on this page are based on the Reference Exchange Rates published by the European Central Bank.
The reference rates are averages of buying and selling rates against the euro, calculated according to the daily concertation procedure between central banks within and outside the European System of Central Banks, by paying due attention to ensuring that the published exchange rates reflect the market conditions prevailing at the time of the daily concertation procedure.
Actual market transactions are affected by a number of factors, such as location and type of transaction (buying or selling), and might be carried at different rates. This data is released for reference purposes only.