| Business / Exchange Rates |
CAD to SGD Exchange Rates:
(Canadian Dollar to Singapore Dollar)
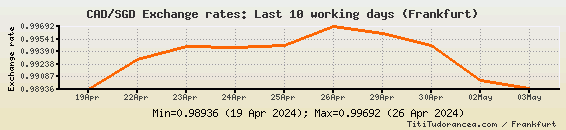
Last 10 working days
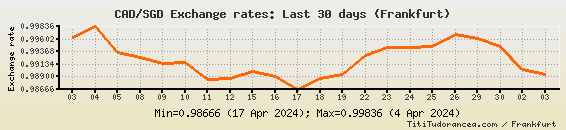
Last 30 days
Wednesday, April 24th: The rate of exchange decreased by 0.00007, to 0.99446.
Thursday, April 18th - Tuesday, April 23rd: The ![]() rose for four trading days in a row, reaching the level of 0.99453 Singapore dollars to the Canadian dollar on Tuesday, April 23rd.
rose for four trading days in a row, reaching the level of 0.99453 Singapore dollars to the Canadian dollar on Tuesday, April 23rd.
Tuesday, April 16th - Wednesday, April 17th: A total decrease of 0.0033 brought the quote to 0.98666. This was the lowest level since March 19th, 2024.
Monday, April 15th: A second consecutive gain brought the CAD/SGD quote to the level of 0.98996 Singapore dollars to the Canadian dollar.
Friday, April 12th: The decline of the Singapore dollar against the Canadian currency restarted; the CAD/SGD exchange ![]() went up to 0.98873.
went up to 0.98873.
Thursday, April 11th: The ![]() dipped to 0.98843.
dipped to 0.98843.
Wednesday, April 10th: The exchange ![]() rose by 0.00019, to 0.99165.
rose by 0.00019, to 0.99165.
Friday, April 5th - Tuesday, April 9th: The pair moved down, reaching 0.99146.
Thursday, April 4th: The rate hit 0.99836 Singapore dollars to the Canadian dollar, the highest level in six weeks.
Wednesday, April 3rd: A small decrease brought the rate to 0.99624.
Thursday, March 28th - Tuesday, April 2nd: The Canadian dollar to Singapore dollar quotation went up for two trading days in a row, reaching 0.99712.
Wednesday, March 27th: The quotation moved down to 0.99144.
Tuesday, March 26th: The quote rose by 0.00176, to 0.99164.
Last 365 days
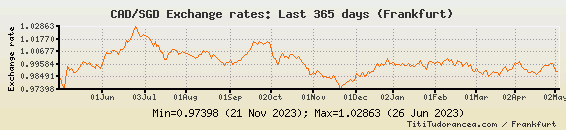
CAD/SGD Exchange rate - Historical data:
| Date: | Exchange rate: |
| 2024-04-24 | 0.99446 |
| 2024-04-23 | 0.99453 |
| 2024-04-22 | 0.99301 |
| 2024-04-19 | 0.98936 |
| 2024-04-18 | 0.98863 |
| 2024-04-17 | 0.98666 |
| 2024-04-16 | 0.98916 |
| 2024-04-15 | 0.98996 |
| 2024-04-12 | 0.98873 |
| 2024-04-11 | 0.98843 |
| 2024-04-10 | 0.99165 |
| 2024-04-09 | 0.99146 |
| 2024-04-08 | 0.99266 |
| 2024-04-05 | 0.99361 |
| 2024-04-04 | 0.99836 |
| 2024-04-03 | 0.99624 |
| 2024-04-02 | 0.99712 |
| 2024-03-28 | 0.99421 |
| 2024-03-27 | 0.99144 |
| 2024-03-26 | 0.99164 |
| 2024-03-25 | 0.98988 |
| 2024-03-22 | 0.99353 |
| 2024-03-21 | 0.99206 |
| 2024-03-20 | 0.98935 |
| 2024-03-19 | 0.98632 |
| 2024-03-18 | 0.98847 |
| 2024-03-15 | 0.98853 |
| 2024-03-14 | 0.98927 |
| 2024-03-13 | 0.98814 |
| 2024-03-12 | 0.98691 |
| 2024-03-11 | 0.98522 |
| 2024-03-08 | 0.99027 |
| 2024-03-07 | 0.98939 |
| 2024-03-06 | 0.987 |
| 2024-03-05 | 0.98854 |
| 2024-03-04 | 0.98988 |
| 2024-03-01 | 0.9921 |
| 2024-02-29 | 0.98988 |
| 2024-02-28 | 0.99081 |
| 2024-02-27 | 0.99549 |
| 2024-02-26 | 0.99373 |
| 2024-02-23 | 0.99767 |
| 2024-02-22 | 0.99549 |
| 2024-02-21 | 0.99357 |
| 2024-02-20 | 0.99746 |
| 2024-02-19 | 0.99869 |
| 2024-02-16 | 0.99876 |
| 2024-02-15 | 0.99484 |
| 2024-02-14 | 0.996 |
| 2024-02-13 | 0.99993 |
| 2024-02-12 | 0.99862 |
| 2024-02-09 | 1.00117 |
| 2024-02-08 | 0.9989 |
| 2024-02-07 | 0.998 |
| 2024-02-06 | 0.99463 |
| 2024-02-05 | 0.99773 |
| 2024-02-02 | 0.99842 |
| 2024-02-01 | 0.99691 |
| 2024-01-31 | 0.99718 |
| 2024-01-30 | 0.99794 |
| 2024-01-29 | 0.99821 |
| 2024-01-26 | 0.99747 |
| 2024-01-25 | 0.99164 |
| 2024-01-24 | 0.99427 |
| 2024-01-23 | 0.99454 |
| 2024-01-22 | 0.99904 |
The cross rates on this page are based on the Reference Exchange Rates published by the European Central Bank.
The reference rates are averages of buying and selling rates against the euro, calculated according to the daily concertation procedure between central banks within and outside the European System of Central Banks, by paying due attention to ensuring that the published exchange rates reflect the market conditions prevailing at the time of the daily concertation procedure.
Actual market transactions are affected by a number of factors, such as location and type of transaction (buying or selling), and might be carried at different rates. This data is released for reference purposes only.