| Business / Energy Data |
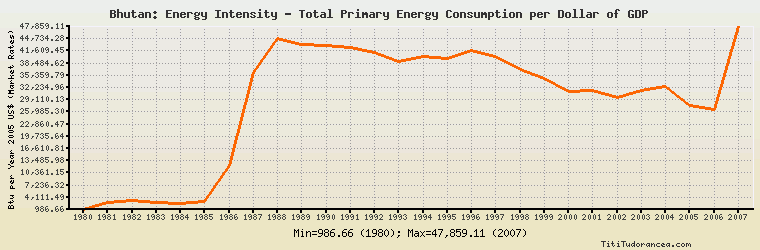
Bhutan: Energy Intensity - Total Primary Energy Consumption per Dollar of GDP
Btu per Year 2005 U.S. Dollars (Market Exchange Rates)
| Year | Bhutan | Change, percent | Bhutan, percent of Asia & Oceania | Bhutan, percent of World |
| 1980 | 986.661 | N/A | 8.081% | N/A |
| 1981 | 2,744.666 | 178.177% | 22.994% | N/A |
| 1982 | 3,330.517 | 21.345% | 28.334% | N/A |
| 1983 | 2,834.053 | -14.907% | 24.139% | N/A |
| 1984 | 2,402.573 | -15.225% | 19.801% | N/A |
| 1985 | 3,013.095 | 25.411% | 25.004% | N/A |
| 1986 | 12,175.825 | 304.097% | 101.138% | N/A |
| 1987 | 35,950.330 | 195.260% | 299.772% | N/A |
| 1988 | 44,722.983 | 24.402% | 371.854% | N/A |
| 1989 | 43,240.772 | -3.314% | 366.090% | N/A |
| 1990 | 43,038.138 | -0.469% | 369.366% | N/A |
| 1991 | 42,358.156 | -1.580% | 362.661% | 372.073% |
| 1992 | 41,214.116 | -2.701% | 352.363% | 368.382% |
| 1993 | 38,836.349 | -5.769% | 324.150% | 347.885% |
| 1994 | 40,145.053 | 3.370% | 326.289% | 366.431% |
| 1995 | 39,734.129 | -1.024% | 322.269% | 365.233% |
| 1996 | 41,631.376 | 4.775% | 344.537% | 384.972% |
| 1997 | 40,095.040 | -3.690% | 327.286% | 378.680% |
| 1998 | 36,732.540 | -8.386% | 301.200% | 353.906% |
| 1999 | 34,421.422 | -6.292% | 283.533% | 336.378% |
| 2000 | 31,130.035 | -9.562% | 263.592% | 310.871% |
| 2001 | 31,490.586 | 1.158% | 264.460% | 317.146% |
| 2002 | 29,713.258 | -5.644% | 243.276% | 297.751% |
| 2003 | 31,356.334 | 5.530% | 248.472% | 311.074% |
| 2004 | 32,546.768 | 3.796% | 242.248% | 318.508% |
| 2005 | 27,583.696 | -15.249% | 203.893% | 271.240% |
| 2006 | 26,663.522 | -3.336% | 198.064% | 266.768% |
| 2007 | 47,859.109 | 79.493% | 376.903% | 502.091% |
| 2008 | N/A | N/A | N/A | N/A |
| 2009 | N/A | N/A | N/A | N/A |
| 2010 | N/A | N/A | N/A | N/A |
Historical Energy Data about Bhutan
Total Consumption of Petroleum Products
Oil and Petroleum Products, Net Exports/Imports (-)
Dry Natural Gas, Net Exports/Imports (-)
Total Primary Coal Production
Total Coal Consumption
Coal, Net Exports/Imports (-)
Total Electricity Net Generation
Total Electricity Net Consumption
Total Electricity Exports
Total Electricity Imports
Electricity, Net Exports/Imports (-)
Total Conventional Thermal Electricity Net Generation
Hydroelectricity Net Generation
Total Primary Energy Production
Total Primary Energy Consumption
Total Carbon Dioxide Emissions from the Consumption of Energy
Population