| Business / Energy Data |
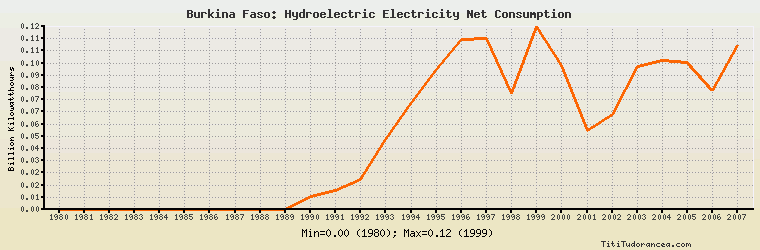
Burkina Faso: Hydroelectric Electricity Net Consumption
Billion Kilowatthours
| Year | Burkina Faso | Change, percent | Burkina Faso, percent of Africa | Burkina Faso, percent of World |
| 1980 | 0.000 | N/A | 0.00% | 0.00% |
| 1981 | 0.000 | 0.000% | 0.00% | 0.00% |
| 1982 | 0.000 | 0.000% | 0.00% | 0.00% |
| 1983 | 0.000 | 0.000% | 0.00% | 0.00% |
| 1984 | 0.000 | 0.000% | 0.00% | 0.00% |
| 1985 | 0.000 | 0.000% | 0.00% | 0.00% |
| 1986 | 0.000 | 0.000% | 0.00% | 0.00% |
| 1987 | 0.000 | 0.000% | 0.00% | 0.00% |
| 1988 | 0.000 | 0.000% | 0.00% | 0.00% |
| 1989 | 0.000 | 0.000% | 0.00% | 0.00% |
| 1990 | 0.009 | 0.000% | 0.016% | 0.000% |
| 1991 | 0.013 | 44.444% | 0.023% | 0.001% |
| 1992 | 0.020 | 53.846% | 0.036% | 0.001% |
| 1993 | 0.047 | 135.000% | 0.086% | 0.002% |
| 1994 | 0.072 | 53.191% | 0.129% | 0.003% |
| 1995 | 0.094 | 30.556% | 0.159% | 0.004% |
| 1996 | 0.114 | 21.277% | 0.184% | 0.005% |
| 1997 | 0.115 | 0.877% | 0.180% | 0.005% |
| 1998 | 0.078 | -32.174% | 0.128% | 0.003% |
| 1999 | 0.123 | 57.692% | 0.171% | 0.005% |
| 2000 | 0.097 | -21.138% | 0.130% | 0.004% |
| 2001 | 0.053 | -45.361% | 0.065% | 0.002% |
| 2002 | 0.064 | 20.755% | 0.077% | 0.002% |
| 2003 | 0.096 | 50.000% | 0.117% | 0.004% |
| 2004 | 0.100 | 4.167% | 0.116% | 0.004% |
| 2005 | 0.099 | -1.000% | 0.111% | 0.003% |
| 2006 | 0.080 | -19.192% | 0.087% | 0.003% |
| 2007 | 0.110 | 37.500% | 0.113% | 0.004% |
| 2008 | N/A | N/A | N/A | N/A |
| 2009 | N/A | N/A | N/A | N/A |
| 2010 | N/A | N/A | N/A | N/A |
Historical Energy Data about Burkina Faso
Total Consumption of Petroleum Products
Oil and Petroleum Products, Net Exports/Imports (-)
Dry Natural Gas, Net Exports/Imports (-)
Coal, Net Exports/Imports (-)
Total Electricity Net Generation
Total Electricity Net Consumption
Electricity, Net Exports/Imports (-)
Total Conventional Thermal Electricity Net Generation
Hydroelectricity Net Generation
Total Primary Energy Production
Total Primary Energy Consumption
Total Carbon Dioxide Emissions from the Consumption of Energy
Population