| Business / Energy Data |
Burma (Myanmar): Proved Reserves of Natural Gas
Trillion Cubic Feet
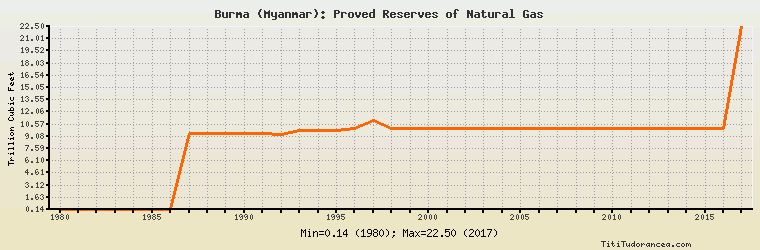
| Year | Burma (Myanmar) | Change, percent | Burma (Myanmar), percent of Asia & Oceania | Burma (Myanmar), percent of World |
| 1980 | 0.135 | N/A | 0.087% | 0.005% |
| 1981 | 0.180 | 33.333% | 0.118% | 0.007% |
| 1982 | 0.170 | -5.556% | 0.110% | 0.006% |
| 1983 | 0.190 | 11.765% | 0.107% | 0.006% |
| 1984 | 0.180 | -5.263% | 0.095% | 0.006% |
| 1985 | 0.170 | -5.556% | 0.085% | 0.005% |
| 1986 | 0.160 | -5.882% | 0.078% | 0.005% |
| 1987 | 9.460 | 5,812.500% | 4.097% | 0.260% |
| 1988 | 9.460 | 0.000% | 3.672% | 0.250% |
| 1989 | 9.460 | 0.000% | 3.429% | 0.241% |
| 1990 | 9.430 | -0.317% | 3.287% | 0.237% |
| 1991 | 9.400 | -0.318% | 3.112% | 0.223% |
| 1992 | 9.350 | -0.532% | 3.124% | 0.356% |
| 1993 | 9.800 | 4.813% | 2.874% | 0.333% |
| 1994 | 9.800 | 0.000% | 2.764% | 0.325% |
| 1995 | 9.800 | 0.000% | 2.795% | 0.326% |
| 1996 | 10.000 | 2.041% | 3.044% | 0.338% |
| 1997 | 11.000 | 10.000% | 3.418% | 0.222% |
| 1998 | 10.000 | -9.091% | 3.120% | 0.197% |
| 1999 | 10.000 | 0.000% | 2.781% | 0.194% |
| 2000 | 10.000 | 0.000% | 2.751% | 0.194% |
| 2001 | 10.000 | 0.000% | 2.739% | 0.189% |
| 2002 | 10.000 | 0.000% | 2.308% | 0.183% |
| 2003 | 10.000 | 0.000% | 2.245% | 0.182% |
| 2004 | 10.000 | 0.000% | 2.247% | 0.165% |
| 2005 | 10.000 | 0.000% | 2.588% | 0.165% |
| 2006 | 10.000 | 0.000% | 2.553% | 0.163% |
| 2007 | 10.000 | 0.000% | 2.383% | 0.162% |
| 2008 | 10.000 | 0.000% | 2.407% | 0.161% |
| 2009 | 10.000 | 0.000% | 2.323% | 0.160% |
| 2010 | 10.000 | 0.000% | 1.857% | 0.151% |
| 2011 | 10.000 | 0.000% | 1.860% | 0.149% |
| 2012 | 10.000 | 0.000% | 1.981% | 0.147% |
| 2013 | 10.000 | 0.000% | 1.918% | 0.146% |
| 2014 | 10.000 | 0.000% | 1.851% | 0.143% |
| 2015 | 10.000 | 0.000% | 2.042% | 0.144% |
| 2016 | 10.000 | 0.000% | 2.037% | 0.145% |
| 2017 | 22.500 | 125.000% | 4.156% | N/A |
Historical Energy Data about Burma (Myanmar)
Total Oil Supply
Total Consumption of Petroleum Products
Oil and Petroleum Products, Net Exports/Imports (-)
Production of Crude Oil including Lease Condensate
Crude Oil Proved Reserves
Dry Natural Gas Production
Dry Natural Gas Consumption
Dry Natural Gas, Net Exports/Imports (-)
Proved Reserves of Natural Gas
Total Primary Coal Production
Total Coal Consumption
Coal, Net Exports/Imports (-)
Total Recoverable Coal
Total Electricity Net Generation
Total Electricity Net Consumption
Electricity, Net Exports/Imports (-)
Total Conventional Thermal Electricity Net Generation
Hydroelectricity Net Generation
Total Primary Energy Production
Total Primary Energy Consumption
Total Carbon Dioxide Emissions from the Consumption of Energy
Population