| Business / Energy Data |
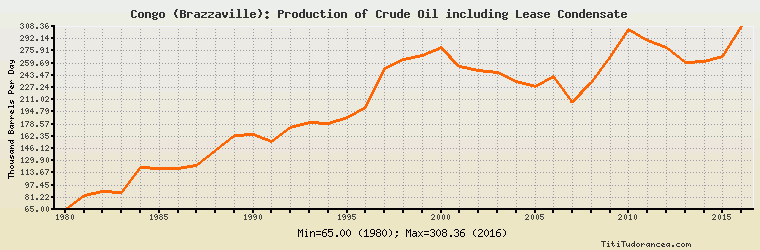
Congo (Brazzaville): Production of Crude Oil including Lease Condensate
Thousand Barrels Per Day
| Year | Congo (Brazzaville) | Change, percent | Congo (Brazzaville), percent of Africa | Congo (Brazzaville), percent of World |
| 1980 | 65.000 | N/A | 1.061% | 0.109% |
| 1981 | 83.000 | 27.692% | 1.739% | 0.148% |
| 1982 | 89.000 | 7.229% | 1.880% | 0.167% |
| 1983 | 87.000 | -2.247% | 1.834% | 0.163% |
| 1984 | 121.000 | 39.080% | 2.363% | 0.222% |
| 1985 | 120.000 | -0.826% | 2.235% | 0.222% |
| 1986 | 119.000 | -0.833% | 2.245% | 0.211% |
| 1987 | 123.000 | 3.361% | 2.340% | 0.217% |
| 1988 | 144.000 | 17.073% | 2.578% | 0.245% |
| 1989 | 164.000 | 13.889% | 2.746% | 0.274% |
| 1990 | 165.000 | 0.610% | 2.563% | 0.273% |
| 1991 | 156.000 | -5.455% | 2.342% | 0.259% |
| 1992 | 174.000 | 11.538% | 2.581% | 0.290% |
| 1993 | 181.000 | 4.023% | 2.724% | 0.301% |
| 1994 | 180.000 | -0.552% | 2.707% | 0.294% |
| 1995 | 188.000 | 4.444% | 2.719% | 0.301% |
| 1996 | 201.000 | 6.915% | 2.832% | 0.315% |
| 1997 | 253.000 | 25.871% | 3.443% | 0.384% |
| 1998 | 265.000 | 4.743% | 3.621% | 0.395% |
| 1999 | 270.000 | 1.887% | 3.726% | 0.409% |
| 2000 | 280.000 | 3.704% | 3.740% | 0.409% |
| 2001 | 255.000 | -8.929% | 3.409% | 0.374% |
| 2002 | 249.203 | -2.273% | 3.298% | 0.370% |
| 2003 | 246.849 | -0.945% | 3.067% | 0.355% |
| 2004 | 235.478 | -4.606% | 2.688% | 0.324% |
| 2005 | 228.625 | -2.910% | 2.418% | 0.310% |
| 2006 | 241.644 | 5.694% | 2.567% | 0.329% |
| 2007 | 207.171 | -14.266% | 2.137% | 0.283% |
| 2008 | 233.270 | 12.598% | 2.375% | 0.315% |
| 2009 | 267.860 | 14.828% | 2.791% | 0.368% |
| 2010 | 305.000 | 13.865% | 3.111% | 0.409% |
| 2011 | 290.000 | -4.918% | 3.403% | 0.388% |
| 2012 | 280.000 | -3.448% | 3.092% | 0.368% |
| 2013 | 261.000 | -6.786% | 3.076% | 0.342% |
| 2014 | 262.000 | 0.383% | 3.276% | 0.335% |
| 2015 | 269.030 | 2.683% | 3.425% | 0.334% |
| 2016 | 308.363 | 14.620% | 4.155% | 0.382% |
Historical Energy Data about Congo (Brazzaville)
Total Oil Supply
Total Consumption of Petroleum Products
Oil and Petroleum Products, Net Exports/Imports (-)
Production of Crude Oil including Lease Condensate
Crude Oil Proved Reserves
Dry Natural Gas Production
Dry Natural Gas Consumption
Dry Natural Gas, Net Exports/Imports (-)
Proved Reserves of Natural Gas
Coal, Net Exports/Imports (-)
Total Electricity Net Generation
Total Electricity Net Consumption
Total Electricity Imports
Electricity, Net Exports/Imports (-)
Total Conventional Thermal Electricity Net Generation
Hydroelectricity Net Generation
Total Biofuels Production
Total Primary Energy Production
Total Primary Energy Consumption
Total Carbon Dioxide Emissions from the Consumption of Energy
Population