| Business / Energy Data |
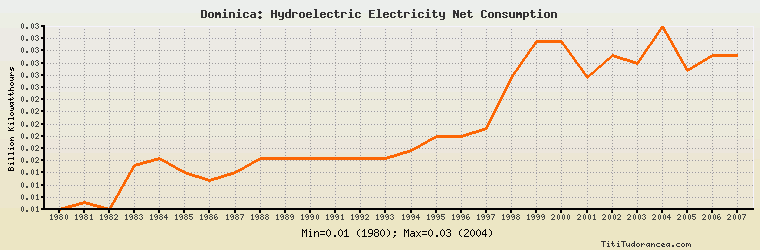
Dominica: Hydroelectric Electricity Net Consumption
Billion Kilowatthours
| Year | Dominica | Change, percent | Dominica, percent of Central & South America | Dominica, percent of World |
| 1980 | 0.009 | N/A | 0.004% | 0.001% |
| 1981 | 0.010 | 11.111% | 0.005% | 0.001% |
| 1982 | 0.009 | -10.000% | 0.004% | 0.001% |
| 1983 | 0.015 | 66.667% | 0.006% | 0.001% |
| 1984 | 0.016 | 6.667% | 0.006% | 0.001% |
| 1985 | 0.014 | -12.500% | 0.005% | 0.001% |
| 1986 | 0.013 | -7.143% | 0.004% | 0.001% |
| 1987 | 0.014 | 7.692% | 0.004% | 0.001% |
| 1988 | 0.016 | 14.286% | 0.005% | 0.001% |
| 1989 | 0.016 | 0.000% | 0.005% | 0.001% |
| 1990 | 0.016 | 0.000% | 0.004% | 0.001% |
| 1991 | 0.016 | 0.000% | 0.004% | 0.001% |
| 1992 | 0.016 | 0.000% | 0.004% | 0.001% |
| 1993 | 0.016 | 0.000% | 0.004% | 0.001% |
| 1994 | 0.017 | 6.250% | 0.004% | 0.001% |
| 1995 | 0.019 | 11.765% | 0.004% | 0.001% |
| 1996 | 0.019 | 0.000% | 0.004% | 0.001% |
| 1997 | 0.020 | 5.263% | 0.004% | 0.001% |
| 1998 | 0.027 | 35.000% | 0.005% | 0.001% |
| 1999 | 0.032 | 18.519% | 0.006% | 0.001% |
| 2000 | 0.032 | 0.000% | 0.006% | 0.001% |
| 2001 | 0.027 | -15.625% | 0.005% | 0.001% |
| 2002 | 0.030 | 11.111% | 0.006% | 0.001% |
| 2003 | 0.029 | -3.333% | 0.005% | 0.001% |
| 2004 | 0.034 | 17.241% | 0.006% | 0.001% |
| 2005 | 0.028 | -17.647% | 0.005% | 0.001% |
| 2006 | 0.030 | 7.143% | 0.005% | 0.001% |
| 2007 | 0.030 | 0.000% | 0.005% | 0.001% |
| 2008 | N/A | N/A | N/A | N/A |
| 2009 | N/A | N/A | N/A | N/A |
| 2010 | N/A | N/A | N/A | N/A |
Historical Energy Data about Dominica
Total Consumption of Petroleum Products
Oil and Petroleum Products, Net Exports/Imports (-)
Dry Natural Gas, Net Exports/Imports (-)
Coal, Net Exports/Imports (-)
Total Electricity Net Generation
Total Electricity Net Consumption
Electricity, Net Exports/Imports (-)
Total Conventional Thermal Electricity Net Generation
Hydroelectricity Net Generation
Total Primary Energy Consumption
Total Carbon Dioxide Emissions from the Consumption of Energy
Population