| Business / Energy Data |
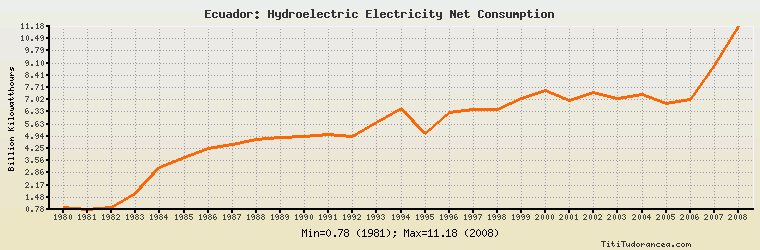
Ecuador: Hydroelectric Electricity Net Consumption
Billion Kilowatthours
| Year | Ecuador | Change, percent | Ecuador, percent of Central & South America | Ecuador, percent of World |
| 1980 | 0.878 | N/A | 0.436% | 0.051% |
| 1981 | 0.783 | -10.820% | 0.384% | 0.045% |
| 1982 | 0.890 | 13.665% | 0.400% | 0.050% |
| 1983 | 1.712 | 92.360% | 0.711% | 0.091% |
| 1984 | 3.163 | 84.755% | 1.198% | 0.164% |
| 1985 | 3.761 | 18.906% | 1.317% | 0.193% |
| 1986 | 4.270 | 13.534% | 1.382% | 0.214% |
| 1987 | 4.486 | 5.059% | 1.390% | 0.225% |
| 1988 | 4.741 | 5.684% | 1.412% | 0.229% |
| 1989 | 4.867 | 2.658% | 1.415% | 0.236% |
| 1990 | 4.937 | 1.438% | 1.362% | 0.230% |
| 1991 | 5.025 | 1.782% | 1.313% | 0.230% |
| 1992 | 4.924 | -2.010% | 1.262% | 0.225% |
| 1993 | 5.752 | 16.816% | 1.368% | 0.249% |
| 1994 | 6.499 | 12.987% | 1.461% | 0.278% |
| 1995 | 5.109 | -21.388% | 1.110% | 0.208% |
| 1996 | 6.281 | 22.940% | 1.308% | 0.252% |
| 1997 | 6.469 | 2.993% | 1.281% | 0.254% |
| 1998 | 6.441 | -0.433% | 1.254% | 0.253% |
| 1999 | 7.105 | 10.309% | 1.377% | 0.274% |
| 2000 | 7.533 | 6.024% | 1.380% | 0.288% |
| 2001 | 7.000 | -7.076% | 1.371% | 0.273% |
| 2002 | 7.450 | 6.429% | 1.396% | 0.286% |
| 2003 | 7.109 | -4.577% | 1.273% | 0.272% |
| 2004 | 7.338 | 3.221% | 1.266% | 0.264% |
| 2005 | 6.814 | -7.141% | 1.114% | 0.236% |
| 2006 | 7.059 | 3.596% | 1.104% | 0.235% |
| 2007 | 8.947 | 26.746% | 1.355% | 0.298% |
| 2008 | 11.180 | 24.958% | N/A | N/A |
| 2009 | N/A | N/A | N/A | N/A |
| 2010 | N/A | N/A | N/A | N/A |
Historical Energy Data about Ecuador
Total Oil Supply
Total Consumption of Petroleum Products
Oil and Petroleum Products, Net Exports/Imports (-)
Production of Crude Oil including Lease Condensate
Crude Oil Proved Reserves
Dry Natural Gas Production
Dry Natural Gas Consumption
Dry Natural Gas, Net Exports/Imports (-)
Proved Reserves of Natural Gas
Total Coal Consumption
Coal, Net Exports/Imports (-)
Total Recoverable Coal
Total Electricity Net Generation
Total Electricity Net Consumption
Total Electricity Exports
Total Electricity Imports
Electricity, Net Exports/Imports (-)
Total Conventional Thermal Electricity Net Generation
Hydroelectricity Net Generation
Total Biofuels Production
Total Primary Energy Production
Total Primary Energy Consumption
Total Carbon Dioxide Emissions from the Consumption of Energy
Population