| Business / Energy Data |
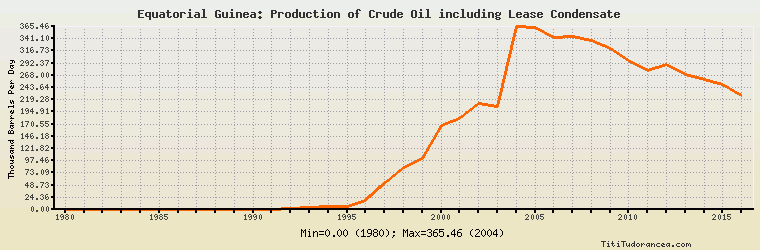
Equatorial Guinea: Production of Crude Oil including Lease Condensate
Thousand Barrels Per Day
| Year | Equatorial Guinea | Change, percent | Equatorial Guinea, percent of Africa | Equatorial Guinea, percent of World |
| 1980 | 0.000 | N/A | 0.00% | 0.00% |
| 1981 | 0.000 | 0.000% | 0.00% | 0.00% |
| 1982 | 0.000 | 0.000% | 0.00% | 0.00% |
| 1983 | 0.000 | 0.000% | 0.00% | 0.00% |
| 1984 | 0.000 | 0.000% | 0.00% | 0.00% |
| 1985 | 0.000 | 0.000% | 0.00% | 0.00% |
| 1986 | 0.000 | 0.000% | 0.00% | 0.00% |
| 1987 | 0.000 | 0.000% | 0.00% | 0.00% |
| 1988 | 0.000 | 0.000% | 0.00% | 0.00% |
| 1989 | 0.000 | 0.000% | 0.00% | 0.00% |
| 1990 | 0.000 | 0.000% | 0.00% | 0.00% |
| 1991 | 0.100 | 0.000% | 0.002% | 0.000% |
| 1992 | 1.600 | 1,500.000% | 0.024% | 0.003% |
| 1993 | 4.500 | 181.250% | 0.068% | 0.007% |
| 1994 | 5.000 | 11.111% | 0.075% | 0.008% |
| 1995 | 5.000 | 0.000% | 0.072% | 0.008% |
| 1996 | 17.000 | 240.000% | 0.240% | 0.027% |
| 1997 | 52.000 | 205.882% | 0.708% | 0.079% |
| 1998 | 83.000 | 59.615% | 1.134% | 0.124% |
| 1999 | 102.000 | 22.892% | 1.407% | 0.155% |
| 2000 | 167.500 | 64.216% | 2.237% | 0.244% |
| 2001 | 181.438 | 8.321% | 2.425% | 0.266% |
| 2002 | 212.562 | 17.154% | 2.813% | 0.316% |
| 2003 | 206.466 | -2.868% | 2.566% | 0.297% |
| 2004 | 365.459 | 77.007% | 4.172% | 0.503% |
| 2005 | 362.534 | -0.800% | 3.834% | 0.491% |
| 2006 | 342.866 | -5.425% | 3.643% | 0.467% |
| 2007 | 345.370 | 0.730% | 3.562% | 0.472% |
| 2008 | 336.834 | -2.472% | 3.429% | 0.455% |
| 2009 | 321.979 | -4.410% | 3.355% | 0.442% |
| 2010 | 297.781 | -7.515% | 3.038% | 0.399% |
| 2011 | 278.388 | -6.513% | 3.267% | 0.373% |
| 2012 | 289.400 | 3.956% | 3.196% | 0.380% |
| 2013 | 269.797 | -6.774% | 3.180% | 0.354% |
| 2014 | 260.000 | -3.631% | 3.251% | 0.333% |
| 2015 | 250.000 | -3.846% | 3.183% | 0.310% |
| 2016 | 227.000 | -9.200% | 3.059% | 0.282% |
Historical Energy Data about Equatorial Guinea
Total Oil Supply
Total Consumption of Petroleum Products
Oil and Petroleum Products, Net Exports/Imports (-)
Production of Crude Oil including Lease Condensate
Crude Oil Proved Reserves
Dry Natural Gas Production
Dry Natural Gas Consumption
Dry Natural Gas, Net Exports/Imports (-)
Proved Reserves of Natural Gas
Coal, Net Exports/Imports (-)
Total Electricity Net Generation
Total Electricity Net Consumption
Electricity, Net Exports/Imports (-)
Total Conventional Thermal Electricity Net Generation
Hydroelectricity Net Generation
Total Primary Energy Production
Total Primary Energy Consumption
Total Carbon Dioxide Emissions from the Consumption of Energy
Population