| Business / Energy Data |
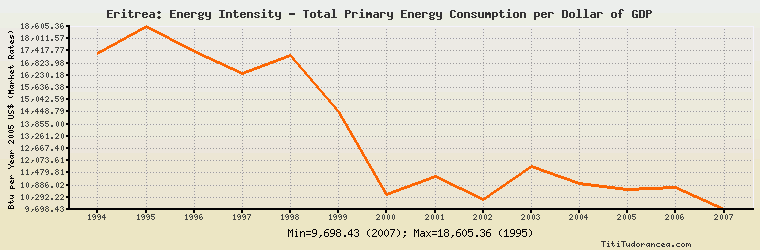
Eritrea: Energy Intensity - Total Primary Energy Consumption per Dollar of GDP
Btu per Year 2005 U.S. Dollars (Market Exchange Rates)
| Year | Eritrea | Change, percent | Eritrea, percent of Africa | Eritrea, percent of World |
| 1980 | N/A | N/A | N/A | N/A |
| 1981 | N/A | N/A | N/A | N/A |
| 1982 | N/A | N/A | N/A | N/A |
| 1983 | N/A | N/A | N/A | N/A |
| 1984 | N/A | N/A | N/A | N/A |
| 1985 | N/A | N/A | N/A | N/A |
| 1986 | N/A | N/A | N/A | N/A |
| 1987 | N/A | N/A | N/A | N/A |
| 1988 | N/A | N/A | N/A | N/A |
| 1989 | N/A | N/A | N/A | N/A |
| 1990 | N/A | N/A | N/A | N/A |
| 1991 | N/A | N/A | N/A | N/A |
| 1992 | N/A | N/A | N/A | N/A |
| 1993 | N/A | N/A | N/A | N/A |
| 1994 | 17,298.588 | N/A | 108.206% | 157.896% |
| 1995 | 18,605.363 | 7.554% | 116.154% | 171.019% |
| 1996 | 17,393.839 | -6.512% | 111.488% | 160.844% |
| 1997 | 16,327.499 | -6.131% | 103.580% | 154.206% |
| 1998 | 17,170.098 | 5.161% | 110.173% | 165.428% |
| 1999 | 14,485.151 | -15.637% | 92.472% | 141.554% |
| 2000 | 10,406.886 | -28.155% | 66.353% | 103.925% |
| 2001 | 11,292.351 | 8.508% | 70.975% | 113.727% |
| 2002 | 10,179.975 | -9.851% | 65.716% | 102.012% |
| 2003 | 11,811.148 | 16.023% | 76.349% | 117.174% |
| 2004 | 10,948.438 | -7.304% | 71.276% | 107.143% |
| 2005 | 10,671.706 | -2.528% | 70.699% | 104.938% |
| 2006 | 10,758.865 | 0.817% | 74.324% | 107.642% |
| 2007 | 9,698.425 | -9.856% | 71.926% | 101.746% |
| 2008 | N/A | N/A | N/A | N/A |
| 2009 | N/A | N/A | N/A | N/A |
| 2010 | N/A | N/A | N/A | N/A |
Historical Energy Data about Eritrea
Total Oil Supply
Total Consumption of Petroleum Products
Oil and Petroleum Products, Net Exports/Imports (-)
Dry Natural Gas, Net Exports/Imports (-)
Coal, Net Exports/Imports (-)
Total Electricity Net Generation
Total Electricity Net Consumption
Electricity, Net Exports/Imports (-)
Total Conventional Thermal Electricity Net Generation
Solar, Tide and Wave Electricity Net Generation
Total Primary Energy Consumption
Total Carbon Dioxide Emissions from the Consumption of Energy
Population