| Business / Energy Data |
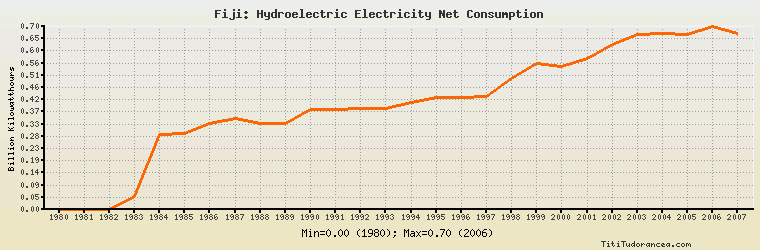
Fiji: Hydroelectric Electricity Net Consumption
Billion Kilowatthours
| Year | Fiji | Change, percent | Fiji, percent of Asia & Oceania | Fiji, percent of World |
| 1980 | 0.000 | N/A | 0.00% | 0.00% |
| 1981 | 0.000 | 0.000% | 0.00% | 0.00% |
| 1982 | 0.000 | 0.000% | 0.00% | 0.00% |
| 1983 | 0.049 | 0.000% | 0.016% | 0.003% |
| 1984 | 0.284 | 479.592% | 0.095% | 0.015% |
| 1985 | 0.290 | 2.113% | 0.092% | 0.015% |
| 1986 | 0.329 | 13.448% | 0.100% | 0.017% |
| 1987 | 0.346 | 5.167% | 0.108% | 0.017% |
| 1988 | 0.327 | -5.491% | 0.090% | 0.016% |
| 1989 | 0.327 | 0.000% | 0.085% | 0.016% |
| 1990 | 0.381 | 16.514% | 0.095% | 0.018% |
| 1991 | 0.381 | 0.000% | 0.093% | 0.017% |
| 1992 | 0.386 | 1.312% | 0.096% | 0.018% |
| 1993 | 0.386 | 0.000% | 0.089% | 0.017% |
| 1994 | 0.406 | 5.181% | 0.091% | 0.017% |
| 1995 | 0.425 | 4.680% | 0.089% | 0.017% |
| 1996 | 0.426 | 0.235% | 0.091% | 0.017% |
| 1997 | 0.430 | 0.939% | 0.089% | 0.017% |
| 1998 | 0.500 | 16.279% | 0.098% | 0.020% |
| 1999 | 0.555 | 11.000% | 0.109% | 0.021% |
| 2000 | 0.545 | -1.802% | 0.105% | 0.021% |
| 2001 | 0.575 | 5.505% | 0.101% | 0.022% |
| 2002 | 0.627 | 9.043% | 0.109% | 0.024% |
| 2003 | 0.665 | 6.061% | 0.111% | 0.025% |
| 2004 | 0.670 | 0.752% | 0.099% | 0.024% |
| 2005 | 0.667 | -0.448% | 0.092% | 0.023% |
| 2006 | 0.697 | 4.498% | 0.087% | 0.023% |
| 2007 | 0.672 | -3.587% | 0.084% | 0.022% |
| 2008 | N/A | N/A | N/A | N/A |
| 2009 | N/A | N/A | N/A | N/A |
| 2010 | N/A | N/A | N/A | N/A |
Historical Energy Data about Fiji
Total Consumption of Petroleum Products
Oil and Petroleum Products, Net Exports/Imports (-)
Dry Natural Gas, Net Exports/Imports (-)
Total Coal Consumption
Coal, Net Exports/Imports (-)
Total Electricity Net Generation
Total Electricity Net Consumption
Electricity, Net Exports/Imports (-)
Total Conventional Thermal Electricity Net Generation
Hydroelectricity Net Generation
Total Primary Energy Production
Total Primary Energy Consumption
Total Carbon Dioxide Emissions from the Consumption of Energy
Population