| Business / Energy Data |
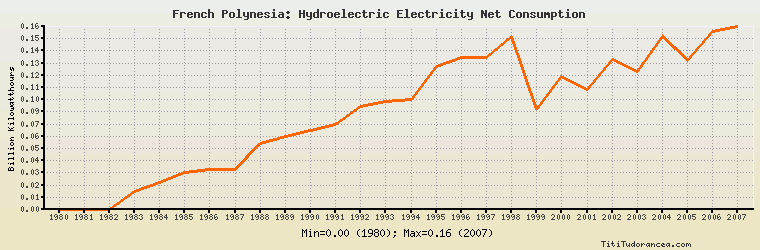
French Polynesia: Hydroelectric Electricity Net Consumption
Billion Kilowatthours
| Year | French Polynesia | Change, percent | French Polynesia, percent of Asia & Oceania | French Polynesia, percent of World |
| 1980 | 0.000 | N/A | 0.00% | 0.00% |
| 1981 | 0.000 | 0.000% | 0.00% | 0.00% |
| 1982 | 0.000 | 0.000% | 0.00% | 0.00% |
| 1983 | 0.016 | 0.000% | 0.005% | 0.001% |
| 1984 | 0.024 | 50.000% | 0.008% | 0.001% |
| 1985 | 0.032 | 33.333% | 0.010% | 0.002% |
| 1986 | 0.035 | 9.375% | 0.011% | 0.002% |
| 1987 | 0.035 | 0.000% | 0.011% | 0.002% |
| 1988 | 0.058 | 65.714% | 0.016% | 0.003% |
| 1989 | 0.064 | 10.345% | 0.017% | 0.003% |
| 1990 | 0.069 | 7.813% | 0.017% | 0.003% |
| 1991 | 0.074 | 7.246% | 0.018% | 0.003% |
| 1992 | 0.090 | 21.622% | 0.022% | 0.004% |
| 1993 | 0.094 | 4.444% | 0.022% | 0.004% |
| 1994 | 0.096 | 2.128% | 0.022% | 0.004% |
| 1995 | 0.125 | 30.208% | 0.026% | 0.005% |
| 1996 | 0.133 | 6.400% | 0.029% | 0.005% |
| 1997 | 0.133 | 0.000% | 0.028% | 0.005% |
| 1998 | 0.151 | 13.534% | 0.030% | 0.006% |
| 1999 | 0.087 | -42.384% | 0.017% | 0.003% |
| 2000 | 0.116 | 33.333% | 0.022% | 0.004% |
| 2001 | 0.105 | -9.483% | 0.018% | 0.004% |
| 2002 | 0.131 | 24.762% | 0.023% | 0.005% |
| 2003 | 0.121 | -7.634% | 0.020% | 0.005% |
| 2004 | 0.151 | 24.793% | 0.022% | 0.005% |
| 2005 | 0.130 | -13.907% | 0.018% | 0.004% |
| 2006 | 0.156 | 20.000% | 0.020% | 0.005% |
| 2007 | 0.160 | 2.564% | 0.020% | 0.005% |
| 2008 | N/A | N/A | N/A | N/A |
| 2009 | N/A | N/A | N/A | N/A |
| 2010 | N/A | N/A | N/A | N/A |
Historical Energy Data about French Polynesia
Total Consumption of Petroleum Products
Oil and Petroleum Products, Net Exports/Imports (-)
Dry Natural Gas, Net Exports/Imports (-)
Coal, Net Exports/Imports (-)
Total Electricity Net Generation
Total Electricity Net Consumption
Electricity, Net Exports/Imports (-)
Total Conventional Thermal Electricity Net Generation
Hydroelectricity Net Generation
Total Primary Energy Production
Total Primary Energy Consumption
Total Carbon Dioxide Emissions from the Consumption of Energy
Population