| Business / Energy Data |
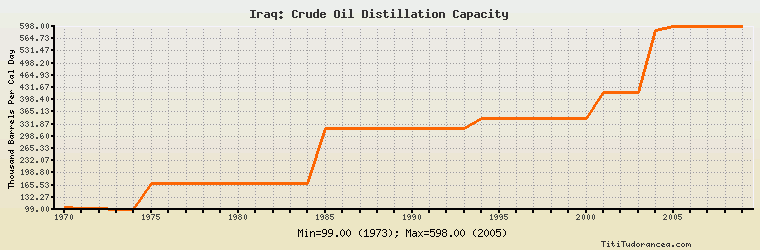
Iraq: Crude Oil Distillation Capacity
Thousand Barrels Per Cal Day
| Year | Iraq | Change, percent | Iraq, percent of Middle East | Iraq, percent of World |
| 1970 | 104.000 | N/A | 4.706% | 0.222% |
| 1971 | 103.000 | -0.962% | 3.675% | 0.200% |
| 1972 | 102.000 | -0.971% | 3.983% | 0.186% |
| 1973 | 99.000 | -2.941% | 4.005% | 0.171% |
| 1974 | 99.000 | 0.000% | 3.842% | 0.158% |
| 1975 | 169.000 | 70.707% | 5.698% | 0.256% |
| 1976 | 169.000 | 0.000% | 5.690% | 0.243% |
| 1977 | 169.000 | 0.000% | 5.590% | 0.234% |
| 1978 | 169.000 | 0.000% | 5.311% | 0.226% |
| 1979 | 169.000 | 0.000% | 5.266% | 0.224% |
| 1980 | 169.000 | 0.000% | 5.341% | 0.220% |
| 1981 | 169.000 | 0.000% | 5.007% | 0.215% |
| 1982 | 169.000 | 0.000% | 5.740% | 0.218% |
| 1983 | 169.000 | 0.000% | 5.250% | 0.228% |
| 1984 | 169.000 | 0.000% | 4.929% | 0.234% |
| 1985 | 319.000 | 88.757% | 8.878% | 0.443% |
| 1986 | 319.000 | 0.000% | 8.362% | 0.459% |
| 1987 | 319.000 | 0.000% | 8.258% | 0.460% |
| 1988 | 319.000 | 0.000% | 7.692% | 0.453% |
| 1989 | 319.000 | 0.000% | 7.357% | 0.456% |
| 1990 | 319.000 | 0.000% | 7.173% | 0.452% |
| 1991 | 319.000 | 0.000% | 6.351% | 0.443% |
| 1992 | 319.000 | 0.000% | 6.389% | 0.423% |
| 1993 | 319.000 | 0.000% | 6.478% | 0.436% |
| 1994 | 348.000 | 9.091% | 6.917% | 0.476% |
| 1995 | 348.000 | 0.000% | 6.621% | 0.469% |
| 1996 | 348.000 | 0.000% | 6.570% | 0.468% |
| 1997 | 348.000 | 0.000% | 6.448% | 0.458% |
| 1998 | 348.000 | 0.000% | 6.176% | 0.446% |
| 1999 | 348.000 | 0.000% | 6.046% | 0.435% |
| 2000 | 348.000 | 0.000% | 5.872% | 0.427% |
| 2001 | 418.000 | 20.115% | 7.008% | 0.514% |
| 2002 | 418.000 | 0.000% | 6.914% | 0.513% |
| 2003 | 418.000 | 0.000% | 6.643% | 0.510% |
| 2004 | 588.000 | 40.670% | 9.099% | 0.715% |
| 2005 | 598.000 | 1.701% | 9.240% | 0.722% |
| 2006 | 598.000 | 0.000% | 8.502% | 0.701% |
| 2007 | 598.000 | 0.000% | 8.497% | 0.701% |
| 2008 | 598.000 | 0.000% | 8.499% | 0.700% |
| 2009 | 598.000 | 0.000% | 8.499% | 0.696% |
| 2010 | N/A | N/A | N/A | N/A |
Historical Energy Data about Iraq
Total Oil Supply
Total Consumption of Petroleum Products
Oil and Petroleum Products, Net Exports/Imports (-)
Production of Crude Oil including Lease Condensate
Crude Oil Proved Reserves
Dry Natural Gas Production
Dry Natural Gas Consumption
Dry Natural Gas, Net Exports/Imports (-)
Proved Reserves of Natural Gas
Total Coal Consumption
Coal, Net Exports/Imports (-)
Total Electricity Net Generation
Total Electricity Net Consumption
Total Electricity Imports
Electricity, Net Exports/Imports (-)
Total Conventional Thermal Electricity Net Generation
Hydroelectricity Net Generation
Total Primary Energy Production
Total Primary Energy Consumption
Total Carbon Dioxide Emissions from the Consumption of Energy
Population