| Business / Energy Data |
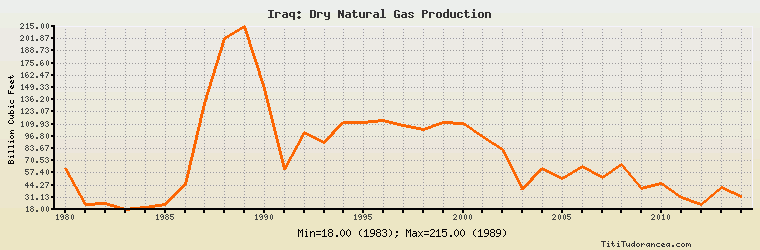
Iraq: Dry Natural Gas Production
Billion Cubic Feet
| Year | Iraq | Change, percent | Iraq, percent of Middle East | Iraq, percent of World |
| 1980 | 62.000 | N/A | 4.354% | 0.116% |
| 1981 | 23.000 | -62.903% | 1.585% | 0.042% |
| 1982 | 24.000 | 4.348% | 1.748% | 0.044% |
| 1983 | 18.000 | -25.000% | 1.187% | 0.033% |
| 1984 | 20.000 | 11.111% | 0.998% | 0.033% |
| 1985 | 23.000 | 15.000% | 0.966% | 0.037% |
| 1986 | 45.000 | 95.652% | 1.708% | 0.071% |
| 1987 | 132.000 | 193.333% | 4.355% | 0.198% |
| 1988 | 202.000 | 53.030% | 6.108% | 0.289% |
| 1989 | 215.000 | 6.436% | 5.826% | 0.298% |
| 1990 | 148.000 | -31.163% | 3.983% | 0.201% |
| 1991 | 61.000 | -58.784% | 1.581% | 0.081% |
| 1992 | 101.000 | 65.574% | 2.440% | 0.134% |
| 1993 | 90.000 | -10.891% | 2.031% | 0.118% |
| 1994 | 112.000 | 24.444% | 2.388% | 0.145% |
| 1995 | 112.000 | 0.000% | 2.246% | 0.143% |
| 1996 | 114.000 | 1.786% | 2.062% | 0.142% |
| 1997 | 108.000 | -5.263% | 1.736% | 0.134% |
| 1998 | 104.000 | -3.704% | 1.577% | 0.127% |
| 1999 | 112.000 | 7.692% | 1.616% | 0.134% |
| 2000 | 111.000 | -0.893% | 1.466% | 0.127% |
| 2001 | 97.000 | -12.613% | 1.215% | 0.109% |
| 2002 | 83.000 | -14.433% | 0.953% | 0.092% |
| 2003 | 39.000 | -53.012% | 0.425% | 0.042% |
| 2004 | 62.000 | 58.974% | 0.623% | 0.065% |
| 2005 | 51.000 | -17.742% | 0.453% | 0.052% |
| 2006 | 64.000 | 25.490% | 0.536% | 0.063% |
| 2007 | 52.000 | -18.750% | 0.413% | 0.050% |
| 2008 | 66.000 | 26.923% | 0.489% | 0.061% |
| 2009 | 41.000 | -37.879% | 0.279% | 0.039% |
| 2010 | 46.000 | 12.195% | 0.276% | 0.041% |
| 2011 | 31.000 | -32.609% | 0.170% | 0.027% |
| 2012 | 23.000 | -25.806% | 0.119% | 0.019% |
| 2013 | 42.000 | 82.609% | 0.211% | 0.035% |
| 2014 | 32.000 | -23.810% | 0.157% | 0.026% |
Historical Energy Data about Iraq
Total Oil Supply
Total Consumption of Petroleum Products
Oil and Petroleum Products, Net Exports/Imports (-)
Production of Crude Oil including Lease Condensate
Crude Oil Proved Reserves
Dry Natural Gas Production
Dry Natural Gas Consumption
Dry Natural Gas, Net Exports/Imports (-)
Proved Reserves of Natural Gas
Total Coal Consumption
Coal, Net Exports/Imports (-)
Total Electricity Net Generation
Total Electricity Net Consumption
Total Electricity Imports
Electricity, Net Exports/Imports (-)
Total Conventional Thermal Electricity Net Generation
Hydroelectricity Net Generation
Total Primary Energy Production
Total Primary Energy Consumption
Total Carbon Dioxide Emissions from the Consumption of Energy
Population