| Business / Energy Data |
Iraq: Proved Reserves of Natural Gas
Trillion Cubic Feet
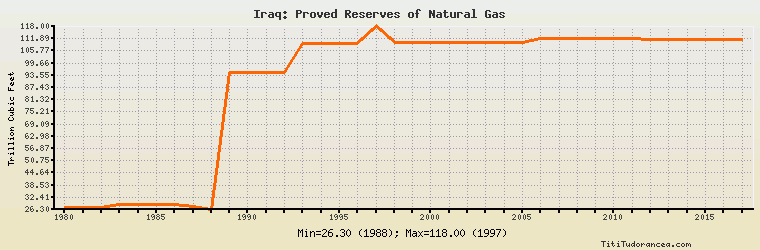
| Year | Iraq | Change, percent | Iraq, percent of Middle East | Iraq, percent of World |
| 1980 | 27.500 | N/A | 3.717% | 1.064% |
| 1981 | 27.450 | -0.182% | 3.651% | 1.037% |
| 1982 | 27.300 | -0.546% | 3.583% | 0.935% |
| 1983 | 28.800 | 5.495% | 3.745% | 0.950% |
| 1984 | 29.000 | 0.694% | 3.747% | 0.906% |
| 1985 | 28.800 | -0.690% | 3.313% | 0.847% |
| 1986 | 29.000 | 0.694% | 3.388% | 0.832% |
| 1987 | 28.000 | -3.448% | 3.026% | 0.769% |
| 1988 | 26.300 | -6.071% | 2.424% | 0.694% |
| 1989 | 95.000 | 261.217% | 8.037% | 2.422% |
| 1990 | 95.000 | 0.000% | 7.748% | 2.387% |
| 1991 | 95.000 | 0.000% | 7.174% | 2.254% |
| 1992 | 95.000 | 0.000% | 7.202% | 3.617% |
| 1993 | 109.500 | 15.263% | 7.203% | 3.723% |
| 1994 | 109.500 | 0.000% | 6.926% | 3.630% |
| 1995 | 109.500 | 0.000% | 6.868% | 3.645% |
| 1996 | 109.500 | 0.000% | 6.856% | 3.702% |
| 1997 | 118.000 | 7.763% | 7.297% | 2.385% |
| 1998 | 109.800 | -6.949% | 6.361% | 2.158% |
| 1999 | 109.800 | 0.000% | 6.276% | 2.135% |
| 2000 | 109.800 | 0.000% | 6.277% | 2.132% |
| 2001 | 109.800 | 0.000% | 5.920% | 2.076% |
| 2002 | 109.800 | 0.000% | 5.561% | 2.012% |
| 2003 | 109.800 | 0.000% | 5.546% | 1.995% |
| 2004 | 110.000 | 0.182% | 4.368% | 1.810% |
| 2005 | 110.000 | 0.000% | 4.361% | 1.820% |
| 2006 | 111.950 | 1.773% | 4.364% | 1.828% |
| 2007 | 112.000 | 0.045% | 4.365% | 1.809% |
| 2008 | 111.940 | -0.054% | 4.392% | 1.802% |
| 2009 | 111.940 | 0.000% | 4.319% | 1.788% |
| 2010 | 111.940 | 0.000% | 4.211% | 1.686% |
| 2011 | 111.940 | 0.000% | 4.167% | 1.669% |
| 2012 | 111.520 | -0.375% | 3.983% | 1.638% |
| 2013 | 111.520 | 0.000% | 3.950% | 1.629% |
| 2014 | 111.522 | 0.002% | 3.965% | 1.600% |
| 2015 | 111.522 | 0.000% | 3.957% | 1.605% |
| 2016 | 111.522 | 0.000% | 3.957% | 1.621% |
| 2017 | 111.522 | 0.000% | 3.993% | N/A |
Historical Energy Data about Iraq
Total Oil Supply
Total Consumption of Petroleum Products
Oil and Petroleum Products, Net Exports/Imports (-)
Production of Crude Oil including Lease Condensate
Crude Oil Proved Reserves
Dry Natural Gas Production
Dry Natural Gas Consumption
Dry Natural Gas, Net Exports/Imports (-)
Proved Reserves of Natural Gas
Total Coal Consumption
Coal, Net Exports/Imports (-)
Total Electricity Net Generation
Total Electricity Net Consumption
Total Electricity Imports
Electricity, Net Exports/Imports (-)
Total Conventional Thermal Electricity Net Generation
Hydroelectricity Net Generation
Total Primary Energy Production
Total Primary Energy Consumption
Total Carbon Dioxide Emissions from the Consumption of Energy
Population