| Business / Energy Data |
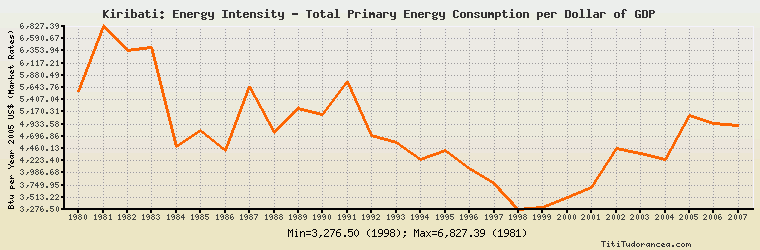
Kiribati: Energy Intensity - Total Primary Energy Consumption per Dollar of GDP
Btu per Year 2005 U.S. Dollars (Market Exchange Rates)
| Year | Kiribati | Change, percent | Kiribati, percent of Asia & Oceania | Kiribati, percent of World |
| 1980 | 5,563.076 | N/A | 45.562% | N/A |
| 1981 | 6,827.394 | 22.727% | 57.197% | N/A |
| 1982 | 6,361.103 | -6.830% | 54.117% | N/A |
| 1983 | 6,422.962 | 0.972% | 54.707% | N/A |
| 1984 | 4,498.204 | -29.967% | 37.071% | N/A |
| 1985 | 4,816.373 | 7.073% | 39.969% | N/A |
| 1986 | 4,413.510 | -8.364% | 36.661% | N/A |
| 1987 | 5,656.779 | 28.170% | 47.169% | N/A |
| 1988 | 4,770.958 | -15.659% | 39.669% | N/A |
| 1989 | 5,231.821 | 9.660% | 44.294% | N/A |
| 1990 | 5,122.556 | -2.088% | 43.963% | N/A |
| 1991 | 5,755.637 | 12.359% | 49.278% | 50.557% |
| 1992 | 4,716.676 | -18.051% | 40.326% | 42.159% |
| 1993 | 4,574.080 | -3.023% | 38.178% | 40.973% |
| 1994 | 4,251.003 | -7.063% | 34.551% | 38.802% |
| 1995 | 4,418.922 | 3.950% | 35.840% | 40.618% |
| 1996 | 4,069.112 | -7.916% | 33.676% | 37.628% |
| 1997 | 3,774.524 | -7.240% | 30.810% | 35.649% |
| 1998 | 3,276.497 | -13.194% | 26.867% | 31.568% |
| 1999 | 3,316.292 | 1.215% | 27.317% | 32.408% |
| 2000 | 3,508.633 | 5.800% | 29.709% | 35.038% |
| 2001 | 3,707.319 | 5.663% | 31.134% | 37.337% |
| 2002 | 4,462.595 | 20.373% | 36.537% | 44.719% |
| 2003 | 4,362.263 | -2.248% | 34.567% | 43.276% |
| 2004 | 4,245.067 | -2.687% | 31.596% | 41.543% |
| 2005 | 5,097.478 | 20.080% | 37.680% | 50.125% |
| 2006 | 4,937.988 | -3.129% | 36.681% | 49.404% |
| 2007 | 4,900.049 | -0.768% | 38.589% | 51.407% |
| 2008 | N/A | N/A | N/A | N/A |
| 2009 | N/A | N/A | N/A | N/A |
| 2010 | N/A | N/A | N/A | N/A |
Historical Energy Data about Kiribati
Total Consumption of Petroleum Products
Oil and Petroleum Products, Net Exports/Imports (-)
Total Electricity Net Generation
Total Electricity Net Consumption
Electricity, Net Exports/Imports (-)
Total Conventional Thermal Electricity Net Generation
Total Primary Energy Consumption
Total Carbon Dioxide Emissions from the Consumption of Energy
Population