| Business / Energy Data |
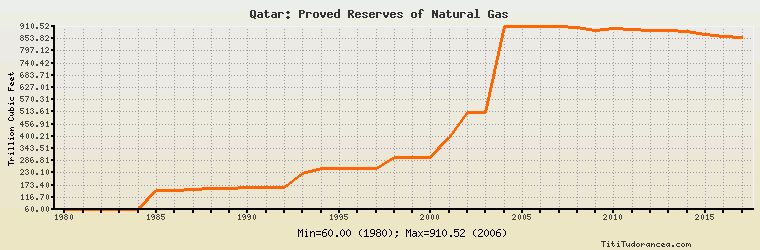
Qatar: Proved Reserves of Natural Gas
Trillion Cubic Feet
| Year | Qatar | Change, percent | Qatar, percent of Middle East | Qatar, percent of World |
| 1980 | 60.000 | N/A | 8.110% | 2.320% |
| 1981 | 60.000 | 0.000% | 7.980% | 2.266% |
| 1982 | 60.000 | 0.000% | 7.876% | 2.054% |
| 1983 | 62.000 | 3.333% | 8.061% | 2.045% |
| 1984 | 62.000 | 0.000% | 8.010% | 1.937% |
| 1985 | 150.000 | 141.935% | 17.254% | 4.410% |
| 1986 | 148.000 | -1.333% | 17.293% | 4.248% |
| 1987 | 152.000 | 2.703% | 16.427% | 4.175% |
| 1988 | 156.700 | 3.092% | 14.443% | 4.136% |
| 1989 | 156.700 | 0.000% | 13.256% | 3.996% |
| 1990 | 163.100 | 4.084% | 13.303% | 4.097% |
| 1991 | 163.200 | 0.061% | 12.324% | 3.872% |
| 1992 | 162.000 | -0.735% | 12.281% | 6.168% |
| 1993 | 227.000 | 40.123% | 14.933% | 7.717% |
| 1994 | 250.000 | 10.132% | 15.813% | 8.288% |
| 1995 | 250.000 | 0.000% | 15.681% | 8.322% |
| 1996 | 250.000 | 0.000% | 15.652% | 8.452% |
| 1997 | 250.000 | 0.000% | 15.460% | 5.054% |
| 1998 | 300.000 | 20.000% | 17.381% | 5.897% |
| 1999 | 300.000 | 0.000% | 17.147% | 5.835% |
| 2000 | 300.000 | 0.000% | 17.150% | 5.826% |
| 2001 | 393.830 | 31.277% | 21.233% | 7.447% |
| 2002 | 508.540 | 29.127% | 25.754% | 9.318% |
| 2003 | 508.540 | 0.000% | 25.688% | 9.238% |
| 2004 | 910.000 | 78.944% | 36.137% | 14.970% |
| 2005 | 910.000 | 0.000% | 36.081% | 15.055% |
| 2006 | 910.520 | 0.057% | 35.492% | 14.868% |
| 2007 | 910.500 | -0.002% | 35.483% | 14.708% |
| 2008 | 905.300 | -0.571% | 35.517% | 14.570% |
| 2009 | 891.945 | -1.475% | 34.416% | 14.244% |
| 2010 | 899.325 | 0.827% | 33.831% | 13.549% |
| 2011 | 895.800 | -0.392% | 33.346% | 13.355% |
| 2012 | 890.000 | -0.647% | 31.786% | 13.071% |
| 2013 | 890.000 | 0.000% | 31.524% | 13.002% |
| 2014 | 885.287 | -0.530% | 31.473% | 12.697% |
| 2015 | 871.585 | -1.548% | 30.928% | 12.540% |
| 2016 | 866.288 | -0.608% | 30.738% | 12.594% |
| 2017 | 858.098 | -0.945% | 30.722% | N/A |
Historical Energy Data about Qatar
Total Oil Supply
Total Consumption of Petroleum Products
Oil and Petroleum Products, Net Exports/Imports (-)
Production of Crude Oil including Lease Condensate
Crude Oil Proved Reserves
Dry Natural Gas Production
Dry Natural Gas Consumption
Dry Natural Gas, Net Exports/Imports (-)
Proved Reserves of Natural Gas
Coal, Net Exports/Imports (-)
Total Electricity Net Generation
Total Electricity Net Consumption
Electricity, Net Exports/Imports (-)
Total Conventional Thermal Electricity Net Generation
Total Primary Energy Production
Total Primary Energy Consumption
Total Carbon Dioxide Emissions from the Consumption of Energy
Population