| Business / Energy Data |
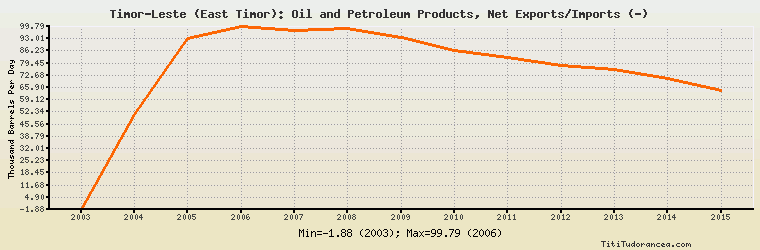
Timor-Leste (East Timor): Oil and Petroleum Products, Net Exports/Imports (-)
Thousand Barrels Per Day
| Year | Timor-Leste (East Timor) | Change, percent | Timor-Leste (East Timor), percent of Asia & Oceania | Timor-Leste (East Timor), percent of World |
| 2003 | -1.880 | N/A | 0.013% | N/A |
| 2004 | 50.710 | -2,797.340% | -0.327% | N/A |
| 2005 | 93.225 | 83.839% | -0.590% | N/A |
| 2006 | 99.786 | 7.038% | -0.612% | N/A |
| 2007 | 97.800 | -1.990% | -0.580% | N/A |
| 2008 | 98.700 | 0.920% | -0.597% | N/A |
| 2009 | 93.492 | -5.277% | -0.542% | N/A |
| 2010 | 86.689 | -7.277% | -0.465% | N/A |
| 2011 | 82.442 | -4.899% | -0.422% | N/A |
| 2012 | 78.195 | -5.152% | -0.380% | N/A |
| 2013 | 76.158 | -2.605% | -0.358% | N/A |
| 2014 | 71.133 | -6.598% | -0.330% | N/A |
| 2015 | 64.048 | -9.960% | -0.284% | N/A |
Historical Energy Data about Timor-Leste (East Timor)
Total Oil Supply
Total Consumption of Petroleum Products
Oil and Petroleum Products, Net Exports/Imports (-)
Production of Crude Oil including Lease Condensate
Dry Natural Gas, Net Exports/Imports (-)
Coal, Net Exports/Imports (-)
Electricity, Net Exports/Imports (-)
Total Primary Energy Production
Total Primary Energy Consumption
Total Carbon Dioxide Emissions from the Consumption of Energy
Population