| Business / Energy Data |
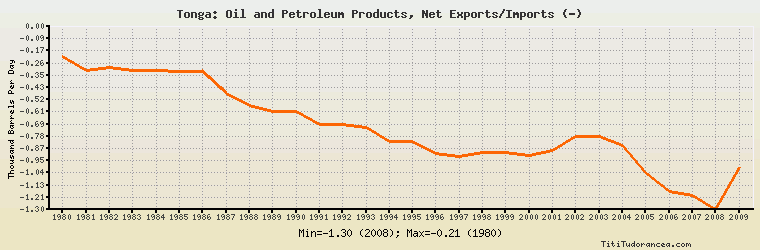
Tonga: Oil and Petroleum Products, Net Exports/Imports (-)
Thousand Barrels Per Day
| Year | Tonga | Change, percent | Tonga, percent of Asia & Oceania | Tonga, percent of World |
| 1980 | -0.210 | N/A | 0.004% | N/A |
| 1981 | -0.310 | 47.619% | 0.006% | N/A |
| 1982 | -0.290 | -6.452% | 0.005% | N/A |
| 1983 | -0.310 | 6.897% | 0.006% | N/A |
| 1984 | -0.310 | 0.000% | 0.006% | N/A |
| 1985 | -0.323 | 4.194% | 0.007% | N/A |
| 1986 | -0.323 | 0.000% | 0.007% | N/A |
| 1987 | -0.474 | 46.749% | 0.009% | N/A |
| 1988 | -0.563 | 18.776% | 0.009% | N/A |
| 1989 | -0.606 | 7.638% | 0.009% | N/A |
| 1990 | -0.606 | 0.000% | 0.009% | N/A |
| 1991 | -0.695 | 14.686% | 0.009% | N/A |
| 1992 | -0.695 | 0.000% | 0.008% | N/A |
| 1993 | -0.720 | 3.597% | 0.008% | N/A |
| 1994 | -0.815 | 13.194% | 0.008% | N/A |
| 1995 | -0.816 | 0.123% | 0.008% | N/A |
| 1996 | -0.901 | 10.417% | 0.008% | N/A |
| 1997 | -0.926 | 2.775% | 0.008% | N/A |
| 1998 | -0.897 | -3.132% | 0.008% | N/A |
| 1999 | -0.897 | 0.000% | 0.007% | N/A |
| 2000 | -0.918 | 2.341% | 0.007% | N/A |
| 2001 | -0.878 | -4.357% | 0.007% | N/A |
| 2002 | -0.780 | -11.162% | 0.006% | N/A |
| 2003 | -0.780 | 0.000% | 0.005% | N/A |
| 2004 | -0.842 | 7.949% | 0.005% | N/A |
| 2005 | -1.035 | 22.922% | 0.007% | N/A |
| 2006 | -1.173 | 13.333% | 0.007% | N/A |
| 2007 | -1.202 | 2.472% | 0.007% | N/A |
| 2008 | -1.300 | 8.153% | 0.008% | N/A |
| 2009 | -1.000 | -23.077% | 0.006% | N/A |
Historical Energy Data about Tonga
Total Consumption of Petroleum Products
Oil and Petroleum Products, Net Exports/Imports (-)
Dry Natural Gas, Net Exports/Imports (-)
Coal, Net Exports/Imports (-)
Total Electricity Net Generation
Total Electricity Net Consumption
Electricity, Net Exports/Imports (-)
Total Conventional Thermal Electricity Net Generation
Total Primary Energy Consumption
Total Carbon Dioxide Emissions from the Consumption of Energy
Population