| Business / Energy Data |
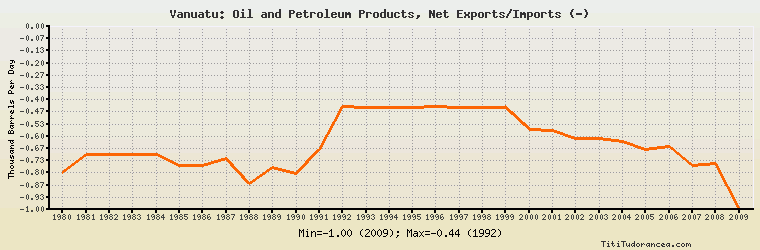
Vanuatu: Oil and Petroleum Products, Net Exports/Imports (-)
Thousand Barrels Per Day
| Year | Vanuatu | Change, percent | Vanuatu, percent of Asia & Oceania | Vanuatu, percent of World |
| 1980 | -0.800 | N/A | 0.014% | N/A |
| 1981 | -0.700 | -12.500% | 0.013% | N/A |
| 1982 | -0.700 | 0.000% | 0.013% | N/A |
| 1983 | -0.700 | 0.000% | 0.014% | N/A |
| 1984 | -0.700 | 0.000% | 0.014% | N/A |
| 1985 | -0.761 | 8.714% | 0.016% | N/A |
| 1986 | -0.762 | 0.131% | 0.015% | N/A |
| 1987 | -0.720 | -5.512% | 0.014% | N/A |
| 1988 | -0.859 | 19.306% | 0.014% | N/A |
| 1989 | -0.770 | -10.361% | 0.012% | N/A |
| 1990 | -0.806 | 4.675% | 0.011% | N/A |
| 1991 | -0.673 | -16.501% | 0.009% | N/A |
| 1992 | -0.439 | -34.770% | 0.005% | N/A |
| 1993 | -0.440 | 0.228% | 0.005% | N/A |
| 1994 | -0.440 | 0.000% | 0.004% | N/A |
| 1995 | -0.440 | 0.000% | 0.004% | N/A |
| 1996 | -0.439 | -0.227% | 0.004% | N/A |
| 1997 | -0.440 | 0.228% | 0.004% | N/A |
| 1998 | -0.440 | 0.000% | 0.004% | N/A |
| 1999 | -0.440 | 0.000% | 0.004% | N/A |
| 2000 | -0.564 | 28.182% | 0.005% | N/A |
| 2001 | -0.566 | 0.355% | 0.004% | N/A |
| 2002 | -0.610 | 7.774% | 0.005% | N/A |
| 2003 | -0.610 | 0.000% | 0.004% | N/A |
| 2004 | -0.628 | 2.951% | 0.004% | N/A |
| 2005 | -0.671 | 6.847% | 0.004% | N/A |
| 2006 | -0.654 | -2.534% | 0.004% | N/A |
| 2007 | -0.761 | 16.361% | 0.005% | N/A |
| 2008 | -0.750 | -1.445% | 0.005% | N/A |
| 2009 | -1.000 | 33.333% | 0.006% | N/A |
Historical Energy Data about Vanuatu
Total Consumption of Petroleum Products
Oil and Petroleum Products, Net Exports/Imports (-)
Dry Natural Gas, Net Exports/Imports (-)
Coal, Net Exports/Imports (-)
Total Electricity Net Generation
Total Electricity Net Consumption
Electricity, Net Exports/Imports (-)
Total Conventional Thermal Electricity Net Generation
Total Primary Energy Consumption
Total Carbon Dioxide Emissions from the Consumption of Energy
Population