| Business / Exchange Rates |
USD to JPY Exchange Rates:
(US Dollar to Japanese Yen)
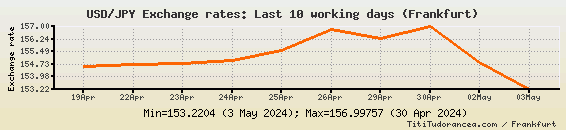
Last 10 working days
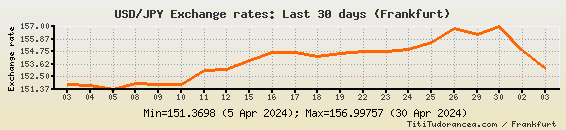
Last 30 days
Friday, April 19th - Thursday, April 25th: The US dollar to Japanese yen exchange rate was up for five trading days in a row, reaching 155.5597. This was an all-time record.
Thursday, April 18th: A second consecutive decline brought the quotation to the level of 154.34029 Japanese yen to the US dollar.
Wednesday, April 17th: The descending trend started again - the USD/JPY quote went down by 0.01454.
Thursday, April 11th - Tuesday, April 16th: The ![]() continued to increase over the next four trading days, reaching 154.68647 Japanese yen to the US dollar on Tuesday, April 16th.
continued to increase over the next four trading days, reaching 154.68647 Japanese yen to the US dollar on Tuesday, April 16th.
Wednesday, April 10th: The Japanese yen started to depreciate again against the US currency; the USD/JPY exchange ![]() gained to 151.83241.
gained to 151.83241.
Tuesday, April 9th: The ![]() decreased to the 151.80823 level.
decreased to the 151.80823 level.
Monday, April 8th: The US dollar to Japanese yen exchange ![]() rose by 0.55665, to 151.92645.
rose by 0.55665, to 151.92645.
Thursday, April 4th - Friday, April 5th: The ![]() decreased by 0.40614, to 151.3698.
decreased by 0.40614, to 151.3698.
Tuesday, April 2nd - Wednesday, April 3rd: The exchange rate continued to increase, reaching 151.77594 Japanese yen to the US dollar on Wednesday, April 3rd.
Thursday, March 28th: The Japanese yen started to depreciate again against the US currency; the USD/JPY exchange rate was up 0.00517.
Wednesday, March 27th: The pair decreased by 0.26751, to 151.18343.
Tuesday, March 26th: The USD/JPY currency pair increased by 0.29266, to 151.45094.
Last 365 days
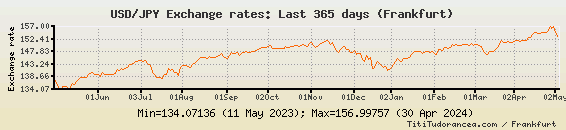
USD/JPY Exchange rate - Historical data:
| Date: | Exchange rate: |
| 2024-04-25 | 155.5597 |
| 2024-04-24 | 154.94104 |
| 2024-04-23 | 154.7967 |
| 2024-04-22 | 154.731 |
| 2024-04-19 | 154.58556 |
| 2024-04-18 | 154.34029 |
| 2024-04-17 | 154.67193 |
| 2024-04-16 | 154.68647 |
| 2024-04-15 | 153.95083 |
| 2024-04-12 | 153.17311 |
| 2024-04-11 | 153.02451 |
| 2024-04-10 | 151.83241 |
| 2024-04-09 | 151.80823 |
| 2024-04-08 | 151.92645 |
| 2024-04-05 | 151.3698 |
| 2024-04-04 | 151.76004 |
| 2024-04-03 | 151.77594 |
| 2024-04-02 | 151.65132 |
| 2024-03-28 | 151.1886 |
| 2024-03-27 | 151.18343 |
| 2024-03-26 | 151.45094 |
| 2024-03-25 | 151.15828 |
| 2024-03-22 | 151.28892 |
| 2024-03-21 | 151.24232 |
| 2024-03-20 | 151.73368 |
| 2024-03-19 | 150.51594 |
| 2024-03-18 | 149.20125 |
| 2024-03-15 | 148.76056 |
| 2024-03-14 | 148.00915 |
| 2024-03-13 | 147.93857 |
| 2024-03-12 | 147.8472 |
| 2024-03-11 | 146.83324 |
| 2024-03-08 | 147.26491 |
| 2024-03-07 | 147.85682 |
| 2024-03-06 | 149.59537 |
| 2024-03-05 | 150.25348 |
| 2024-03-04 | 150.48866 |
| 2024-03-01 | 150.57801 |
| 2024-02-29 | 150.12932 |
| 2024-02-28 | 150.69393 |
| 2024-02-27 | 150.18423 |
| 2024-02-26 | 150.55289 |
| 2024-02-23 | 150.36921 |
| 2024-02-22 | 150.4242 |
| 2024-02-21 | 149.98612 |
| 2024-02-20 | 150.13886 |
| 2024-02-19 | 149.9536 |
| 2024-02-16 | 150.33432 |
| 2024-02-15 | 150.10705 |
| 2024-02-14 | 150.54607 |
| 2024-02-13 | 149.32827 |
| 2024-02-12 | 148.99285 |
| 2024-02-09 | 149.46157 |
| 2024-02-08 | 149.23778 |
| 2024-02-07 | 148.20898 |
| 2024-02-06 | 148.52462 |
| 2024-02-05 | 148.63205 |
| 2024-02-02 | 146.63236 |
| 2024-02-01 | 146.99464 |
| 2024-01-31 | 147.81766 |
| 2024-01-30 | 147.49216 |
| 2024-01-29 | 147.95343 |
| 2024-01-26 | 147.7509 |
| 2024-01-25 | 147.62692 |
| 2024-01-24 | 147.14351 |
| 2024-01-23 | 147.97645 |
The cross rates on this page are based on the Reference Exchange Rates published by the European Central Bank.
The reference rates are averages of buying and selling rates against the euro, calculated according to the daily concertation procedure between central banks within and outside the European System of Central Banks, by paying due attention to ensuring that the published exchange rates reflect the market conditions prevailing at the time of the daily concertation procedure.
Actual market transactions are affected by a number of factors, such as location and type of transaction (buying or selling), and might be carried at different rates. This data is released for reference purposes only.