| Business / Exchange Rates |
USD to MYR Exchange Rates:
(US Dollar to Malaysian Ringgit)
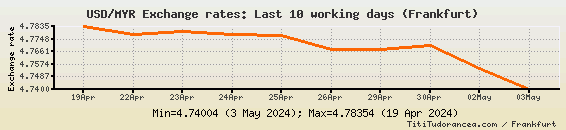
Last 10 working days
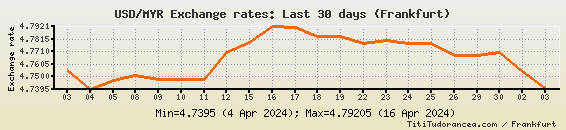
Last 30 days
Wednesday, April 24th: The USD/MYR quotation decreased slightly, from 4.78003 to 4.77803.
Tuesday, April 23rd: The rate increased slightly, reaching 4.78003.
Monday, April 22nd: A slight decline of 0.00551 brought the USD/MYR currency pair to 4.77803.
Friday, April 19th: An 0.00004 up-tick brought the US dollar to Malaysian ringgit quotation to 4.78354.
Wednesday, April 17th - Thursday, April 18th: The quote decreased for two trading days in a row, reaching the 4.7835 level on Thursday, April 18th.
Friday, April 12th - Tuesday, April 16th: The ![]() of exchange went up for three trading days in a row, reaching 4.79205, the highest reading in seven weeks.
of exchange went up for three trading days in a row, reaching 4.79205, the highest reading in seven weeks.
Thursday, April 11th: The US dollar remained unchanged against the Malaysian ringgit at 4.74751.
Wednesday, April 10th: The USD/MYR cross increased by 0.00002, to 4.74751.
Tuesday, April 9th: A small loss of 0.00397 brought the quote to 4.74749.
Monday, April 8th: A second consecutive addition brought the USD/MYR quote to 4.75146.
Friday, April 5th: The US dollar started to appreciate again against the Malaysian ringgit, the rate rising to 4.74698.
Thursday, April 4th: The USD/MYR exchange rate dipped from 4.75498 to 4.7395.
Tuesday, April 2nd - Wednesday, April 3rd: Two consecutive increases brought the currency pair to 4.75498.
Thursday, March 28th: The US dollar to Malaysian ringgit quotation decreased by 0.00003, to 4.73296.
Wednesday, March 27th: A mild gain brought the USD/MYR currency pair to 4.73299.
Tuesday, March 26th: The pair went down to 4.72004. This was the lowest reading since March 21st, 2024.
Last 365 days

USD/MYR Exchange rate - Historical data:
| Date: | Exchange rate: |
| 2024-04-24 | 4.77803 |
| 2024-04-23 | 4.78003 |
| 2024-04-22 | 4.77803 |
| 2024-04-19 | 4.78354 |
| 2024-04-18 | 4.7835 |
| 2024-04-17 | 4.7915 |
| 2024-04-16 | 4.79205 |
| 2024-04-15 | 4.779 |
| 2024-04-12 | 4.77 |
| 2024-04-11 | 4.74751 |
| 2024-04-10 | 4.74751 |
| 2024-04-09 | 4.74749 |
| 2024-04-08 | 4.75146 |
| 2024-04-05 | 4.74698 |
| 2024-04-04 | 4.7395 |
| 2024-04-03 | 4.75498 |
| 2024-04-02 | 4.75449 |
| 2024-03-28 | 4.73296 |
| 2024-03-27 | 4.73299 |
| 2024-03-26 | 4.72004 |
| 2024-03-25 | 4.72497 |
| 2024-03-22 | 4.7375 |
| 2024-03-21 | 4.71477 |
| 2024-03-20 | 4.73801 |
| 2024-03-19 | 4.733 |
| 2024-03-18 | 4.71851 |
| 2024-03-15 | 4.70446 |
| 2024-03-14 | 4.68604 |
| 2024-03-13 | 4.688 |
| 2024-03-12 | 4.67754 |
| 2024-03-11 | 4.68396 |
| 2024-03-08 | 4.68496 |
| 2024-03-07 | 4.70546 |
| 2024-03-06 | 4.73202 |
| 2024-03-05 | 4.735 |
| 2024-03-04 | 4.72349 |
| 2024-03-01 | 4.74595 |
| 2024-02-29 | 4.74552 |
| 2024-02-28 | 4.771 |
| 2024-02-27 | 4.76197 |
| 2024-02-26 | 4.777 |
| 2024-02-23 | 4.77746 |
| 2024-02-22 | 4.77647 |
| 2024-02-21 | 4.79397 |
| 2024-02-20 | 4.79754 |
| 2024-02-19 | 4.78703 |
| 2024-02-16 | 4.78046 |
| 2024-02-15 | 4.78107 |
| 2024-02-14 | 4.78587 |
| 2024-02-13 | 4.76596 |
| 2024-02-12 | 4.76599 |
| 2024-02-09 | 4.76504 |
| 2024-02-08 | 4.76947 |
| 2024-02-07 | 4.76104 |
| 2024-02-06 | 4.76552 |
| 2024-02-05 | 4.75051 |
| 2024-02-02 | 4.71671 |
| 2024-02-01 | 4.72998 |
| 2024-01-31 | 4.73 |
| 2024-01-30 | 4.72746 |
| 2024-01-29 | 4.73399 |
| 2024-01-26 | 4.72753 |
| 2024-01-25 | 4.73148 |
| 2024-01-24 | 4.7315 |
| 2024-01-23 | 4.72701 |
| 2024-01-22 | 4.72654 |
The cross rates on this page are based on the Reference Exchange Rates published by the European Central Bank.
The reference rates are averages of buying and selling rates against the euro, calculated according to the daily concertation procedure between central banks within and outside the European System of Central Banks, by paying due attention to ensuring that the published exchange rates reflect the market conditions prevailing at the time of the daily concertation procedure.
Actual market transactions are affected by a number of factors, such as location and type of transaction (buying or selling), and might be carried at different rates. This data is released for reference purposes only.