| Business / Oil Prices |
WTI Cushing Crude Oil Spot Prices
History and Charts
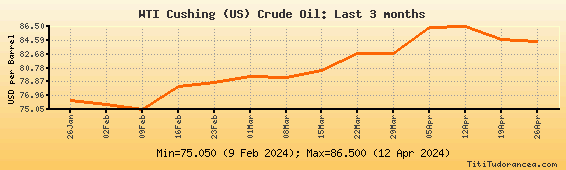
Last 3 months
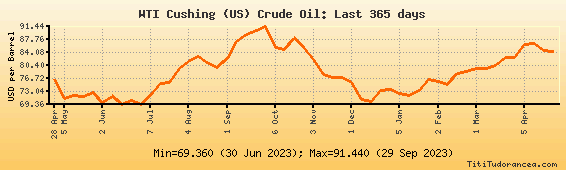
Last 365 days
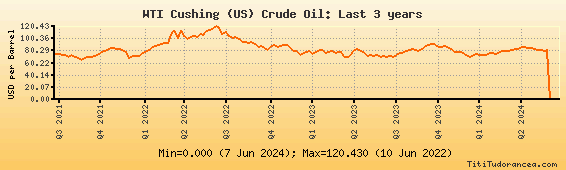
Last 3 years
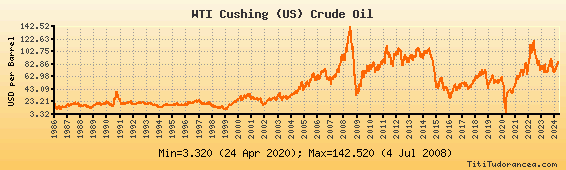
All available data
WTI Cushing (US) Crude Oil Prices: One-Year Historical data
(Historical Spot Prices)
| Date: | WTI Cushing (US) Crude Oil (USD per Barrel): |
| 2024-04-19 | 84.650 |
| 2024-04-12 | 86.500 |
| 2024-04-05 | 86.350 |
| 2024-03-29 | 82.730 |
| 2024-03-22 | 82.790 |
| 2024-03-15 | 80.430 |
| 2024-03-08 | 79.530 |
| 2024-03-01 | 79.580 |
| 2024-02-23 | 78.710 |
| 2024-02-16 | 78.170 |
| 2024-02-09 | 75.050 |
| 2024-02-02 | 75.780 |
| 2024-01-26 | 76.360 |
| 2024-01-19 | 73.360 |
| 2024-01-12 | 72.030 |
| 2024-01-05 | 72.490 |
| 2023-12-29 | 73.520 |
| 2023-12-22 | 73.230 |
| 2023-12-15 | 70.110 |
| 2023-12-08 | 70.710 |
| 2023-12-01 | 75.490 |
| 2023-11-24 | 77.020 |
| 2023-11-17 | 76.980 |
| 2023-11-10 | 77.920 |
| 2023-11-03 | 81.990 |
| 2023-10-27 | 85.200 |
| 2023-10-20 | 88.030 |
| 2023-10-13 | 85.030 |
| 2023-10-06 | 85.500 |
| 2023-09-29 | 91.440 |
| 2023-09-22 | 90.280 |
| 2023-09-15 | 89.140 |
| 2023-09-08 | 87.170 |
| 2023-09-01 | 82.500 |
| 2023-08-25 | 79.970 |
| 2023-08-18 | 80.930 |
| 2023-08-11 | 83.040 |
| 2023-08-04 | 81.400 |
| 2023-07-28 | 79.680 |
| 2023-07-21 | 75.610 |
| 2023-07-14 | 75.200 |
| 2023-07-07 | 71.790 |
| 2023-06-30 | 69.360 |
| 2023-06-23 | 70.410 |
| 2023-06-16 | 69.420 |
| 2023-06-09 | 71.560 |
| 2023-06-02 | 69.850 |
| 2023-05-26 | 72.620 |
| 2023-05-19 | 71.620 |
| 2023-05-12 | 72.030 |
| 2023-05-05 | 71.160 |
| 2023-04-28 | 76.310 |
Source: DOE, US