| Business / Oil Prices |
Brent Crude Oil Spot Prices
History and Charts
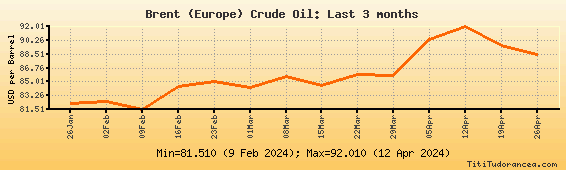
Last 3 months
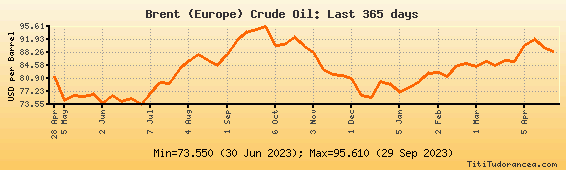
Last 365 days
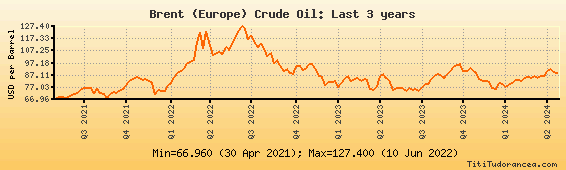
Last 3 years
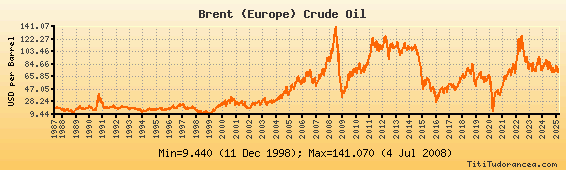
All available data
Brent (Europe) Crude Oil Prices: One-Year Historical data
(Historical Spot Prices)
| Date: | Brent (Europe) Crude Oil (USD per Barrel): |
| 2024-04-12 | 92.010 |
| 2024-04-05 | 90.340 |
| 2024-03-29 | 85.800 |
| 2024-03-22 | 85.880 |
| 2024-03-15 | 84.520 |
| 2024-03-08 | 85.630 |
| 2024-03-01 | 84.260 |
| 2024-02-23 | 85.020 |
| 2024-02-16 | 84.440 |
| 2024-02-09 | 81.510 |
| 2024-02-02 | 82.570 |
| 2024-01-26 | 82.310 |
| 2024-01-19 | 80.110 |
| 2024-01-12 | 78.400 |
| 2024-01-05 | 76.880 |
| 2023-12-29 | 79.230 |
| 2023-12-22 | 80.150 |
| 2023-12-15 | 75.580 |
| 2023-12-08 | 75.980 |
| 2023-12-01 | 80.910 |
| 2023-11-24 | 81.620 |
| 2023-11-17 | 81.930 |
| 2023-11-10 | 83.520 |
| 2023-11-03 | 88.210 |
| 2023-10-27 | 89.840 |
| 2023-10-20 | 92.470 |
| 2023-10-13 | 90.480 |
| 2023-10-06 | 90.330 |
| 2023-09-29 | 95.610 |
| 2023-09-22 | 94.860 |
| 2023-09-15 | 93.870 |
| 2023-09-08 | 91.290 |
| 2023-09-01 | 87.570 |
| 2023-08-25 | 84.710 |
| 2023-08-18 | 85.870 |
| 2023-08-11 | 87.830 |
| 2023-08-04 | 85.630 |
| 2023-07-28 | 83.550 |
| 2023-07-21 | 79.480 |
| 2023-07-14 | 79.790 |
| 2023-07-07 | 76.600 |
| 2023-06-30 | 73.550 |
| 2023-06-23 | 75.260 |
| 2023-06-16 | 74.390 |
| 2023-06-09 | 76.060 |
| 2023-06-02 | 73.890 |
| 2023-05-26 | 76.480 |
| 2023-05-19 | 75.750 |
| 2023-05-12 | 76.080 |
| 2023-05-05 | 74.620 |
| 2023-04-28 | 81.400 |
| 2023-04-21 | 84.620 |
Source: DOE, US