| Business / Energy Data |
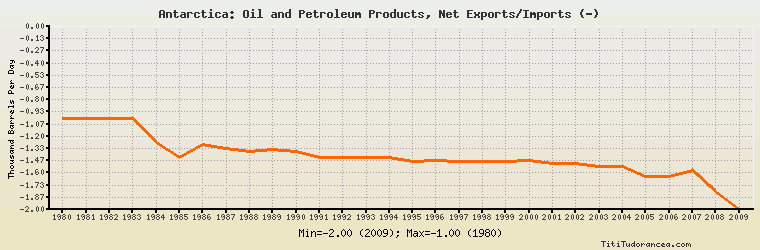
Antarctica: Oil and Petroleum Products, Net Exports/Imports (-)
Thousand Barrels Per Day
| Year | Antarctica | Change, percent | Antarctica, percent of Central & South America | Antarctica, percent of World |
| 1980 | -1.000 | N/A | -0.181% | N/A |
| 1981 | -1.000 | 0.000% | -0.331% | N/A |
| 1982 | -1.000 | 0.000% | -0.379% | N/A |
| 1983 | -1.000 | 0.000% | -0.227% | N/A |
| 1984 | -1.270 | 27.000% | -0.204% | N/A |
| 1985 | -1.431 | 12.677% | -0.208% | N/A |
| 1986 | -1.288 | -9.993% | -0.189% | N/A |
| 1987 | -1.328 | 3.106% | -0.261% | N/A |
| 1988 | -1.366 | 2.861% | -0.194% | N/A |
| 1989 | -1.349 | -1.245% | -0.182% | N/A |
| 1990 | -1.369 | 1.483% | -0.147% | N/A |
| 1991 | -1.431 | 4.529% | -0.128% | N/A |
| 1992 | -1.427 | -0.280% | -0.130% | N/A |
| 1993 | -1.431 | 0.280% | -0.118% | N/A |
| 1994 | -1.431 | 0.000% | -0.102% | N/A |
| 1995 | -1.472 | 2.865% | -0.089% | N/A |
| 1996 | -1.468 | -0.272% | -0.080% | N/A |
| 1997 | -1.472 | 0.272% | -0.070% | N/A |
| 1998 | -1.472 | 0.000% | -0.072% | N/A |
| 1999 | -1.472 | 0.000% | -0.081% | N/A |
| 2000 | -1.468 | -0.272% | -0.073% | N/A |
| 2001 | -1.492 | 1.635% | -0.079% | N/A |
| 2002 | -1.492 | 0.000% | -0.088% | N/A |
| 2003 | -1.533 | 2.748% | -0.103% | N/A |
| 2004 | -1.529 | -0.261% | -0.096% | N/A |
| 2005 | -1.635 | 6.933% | -0.100% | N/A |
| 2006 | -1.635 | 0.000% | -0.110% | N/A |
| 2007 | -1.574 | -3.731% | -0.117% | N/A |
| 2008 | -1.800 | 14.358% | -0.108% | N/A |
| 2009 | -2.000 | 11.111% | -0.130% | N/A |
Historical Energy Data about Antarctica
Total Consumption of Petroleum Products
Oil and Petroleum Products, Net Exports/Imports (-)
Dry Natural Gas, Net Exports/Imports (-)
Coal, Net Exports/Imports (-)
Electricity, Net Exports/Imports (-)
Total Primary Energy Consumption
Total Carbon Dioxide Emissions from the Consumption of Energy