| Business / Energy Data |
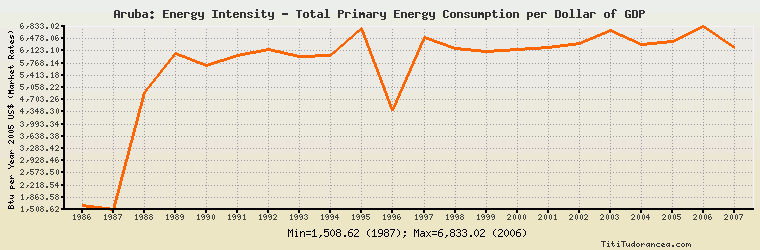
Aruba: Energy Intensity - Total Primary Energy Consumption per Dollar of GDP
Btu per Year 2005 U.S. Dollars (Market Exchange Rates)
| Year | Aruba | Change, percent | Aruba, percent of Central & South America | Aruba, percent of World |
| 1980 | N/A | N/A | N/A | N/A |
| 1981 | N/A | N/A | N/A | N/A |
| 1982 | N/A | N/A | N/A | N/A |
| 1983 | N/A | N/A | N/A | N/A |
| 1984 | N/A | N/A | N/A | N/A |
| 1985 | N/A | N/A | N/A | N/A |
| 1986 | 1,618.749 | N/A | 14.849% | N/A |
| 1987 | 1,508.619 | -6.803% | 14.031% | N/A |
| 1988 | 4,918.377 | 226.018% | 45.050% | N/A |
| 1989 | 6,061.283 | 23.237% | 54.187% | N/A |
| 1990 | 5,700.870 | -5.946% | 49.216% | N/A |
| 1991 | 5,976.909 | 4.842% | 50.940% | 52.501% |
| 1992 | 6,171.841 | 3.261% | 53.152% | 55.165% |
| 1993 | 5,959.133 | -3.446% | 50.943% | 53.380% |
| 1994 | 6,001.257 | 0.707% | 51.525% | 54.778% |
| 1995 | 6,761.496 | 12.668% | 57.707% | 62.151% |
| 1996 | 4,392.884 | -35.031% | 36.633% | 40.622% |
| 1997 | 6,519.972 | 48.421% | 54.115% | 61.578% |
| 1998 | 6,179.184 | -5.227% | 50.284% | 59.534% |
| 1999 | 6,108.133 | -1.150% | 49.121% | 59.691% |
| 2000 | 6,168.293 | 0.985% | 49.898% | 61.598% |
| 2001 | 6,208.661 | 0.654% | 50.162% | 62.528% |
| 2002 | 6,344.346 | 2.185% | 51.553% | 63.576% |
| 2003 | 6,730.104 | 6.080% | 54.471% | 66.767% |
| 2004 | 6,310.487 | -6.235% | 52.316% | 61.756% |
| 2005 | 6,401.624 | 1.444% | 53.486% | 62.949% |
| 2006 | 6,833.023 | 6.739% | 56.449% | 68.364% |
| 2007 | 6,223.592 | -8.919% | 59.222% | 65.292% |
| 2008 | N/A | N/A | N/A | N/A |
| 2009 | N/A | N/A | N/A | N/A |
| 2010 | N/A | N/A | N/A | N/A |
Historical Energy Data about Aruba
Total Oil Supply
Total Consumption of Petroleum Products
Oil and Petroleum Products, Net Exports/Imports (-)
Dry Natural Gas, Net Exports/Imports (-)
Coal, Net Exports/Imports (-)
Total Electricity Net Generation
Total Electricity Net Consumption
Electricity, Net Exports/Imports (-)
Total Conventional Thermal Electricity Net Generation
Total Primary Energy Consumption
Total Carbon Dioxide Emissions from the Consumption of Energy
Population