| Business / Energy Data |
Bahrain: Crude Oil Proved Reserves
Billion Barrels
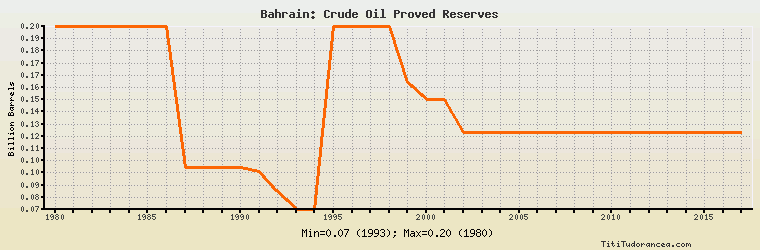
| Year | Bahrain | Change, percent | Bahrain, percent of Middle East | Bahrain, percent of World |
| 1980 | 0.200 | N/A | 0.055% | 0.031% |
| 1981 | 0.200 | 0.000% | 0.055% | 0.031% |
| 1982 | 0.200 | 0.000% | 0.055% | 0.030% |
| 1983 | 0.200 | 0.000% | 0.054% | 0.030% |
| 1984 | 0.200 | 0.000% | 0.054% | 0.030% |
| 1985 | 0.200 | 0.000% | 0.050% | 0.029% |
| 1986 | 0.200 | 0.000% | 0.050% | 0.029% |
| 1987 | 0.100 | -50.000% | 0.025% | 0.014% |
| 1988 | 0.100 | 0.000% | 0.018% | 0.011% |
| 1989 | 0.100 | 0.000% | 0.017% | 0.011% |
| 1990 | 0.100 | 0.000% | 0.015% | 0.010% |
| 1991 | 0.097 | -3.000% | 0.015% | 0.010% |
| 1992 | 0.083 | -14.433% | 0.013% | 0.009% |
| 1993 | 0.070 | -15.663% | 0.011% | 0.007% |
| 1994 | 0.070 | 0.000% | 0.011% | 0.007% |
| 1995 | 0.200 | 185.714% | 0.030% | 0.021% |
| 1996 | 0.200 | 0.000% | 0.030% | 0.021% |
| 1997 | 0.200 | 0.000% | 0.030% | 0.020% |
| 1998 | 0.200 | 0.000% | 0.029% | 0.020% |
| 1999 | 0.160 | -20.000% | 0.024% | 0.015% |
| 2000 | 0.148 | -7.500% | 0.022% | 0.015% |
| 2001 | 0.148 | 0.000% | 0.022% | 0.014% |
| 2002 | 0.125 | -15.541% | 0.018% | 0.012% |
| 2003 | 0.125 | 0.000% | 0.018% | 0.010% |
| 2004 | 0.125 | 0.000% | 0.017% | 0.010% |
| 2005 | 0.125 | 0.000% | 0.017% | 0.010% |
| 2006 | 0.125 | 0.000% | 0.017% | 0.010% |
| 2007 | 0.125 | 0.000% | 0.017% | 0.009% |
| 2008 | 0.125 | 0.000% | 0.017% | 0.009% |
| 2009 | 0.125 | 0.000% | 0.017% | 0.009% |
| 2010 | 0.125 | 0.000% | 0.017% | 0.009% |
| 2011 | 0.125 | 0.000% | 0.017% | 0.008% |
| 2012 | 0.125 | 0.000% | 0.016% | 0.008% |
| 2013 | 0.125 | 0.000% | 0.016% | 0.008% |
| 2014 | 0.125 | 0.000% | 0.016% | 0.008% |
| 2015 | 0.125 | 0.000% | 0.016% | 0.008% |
| 2016 | 0.125 | 0.000% | 0.016% | 0.008% |
| 2017 | 0.125 | 0.000% | 0.016% | N/A |
Historical Energy Data about Bahrain
Total Oil Supply
Total Consumption of Petroleum Products
Oil and Petroleum Products, Net Exports/Imports (-)
Production of Crude Oil including Lease Condensate
Crude Oil Proved Reserves
Dry Natural Gas Production
Dry Natural Gas Consumption
Dry Natural Gas, Net Exports/Imports (-)
Proved Reserves of Natural Gas
Coal, Net Exports/Imports (-)
Total Electricity Net Generation
Total Electricity Net Consumption
Electricity, Net Exports/Imports (-)
Total Conventional Thermal Electricity Net Generation
Total Primary Energy Production
Total Primary Energy Consumption
Total Carbon Dioxide Emissions from the Consumption of Energy
Population