| Business / Energy Data |
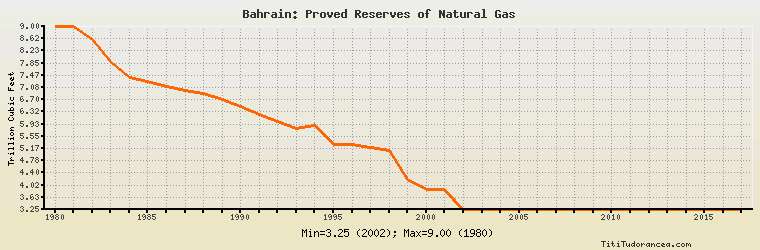
Bahrain: Proved Reserves of Natural Gas
Trillion Cubic Feet
| Year | Bahrain | Change, percent | Bahrain, percent of Middle East | Bahrain, percent of World |
| 1980 | 9.000 | N/A | 1.216% | 0.348% |
| 1981 | 9.000 | 0.000% | 1.197% | 0.340% |
| 1982 | 8.600 | -4.444% | 1.129% | 0.294% |
| 1983 | 7.890 | -8.256% | 1.026% | 0.260% |
| 1984 | 7.400 | -6.210% | 0.956% | 0.231% |
| 1985 | 7.260 | -1.892% | 0.835% | 0.213% |
| 1986 | 7.103 | -2.163% | 0.830% | 0.204% |
| 1987 | 7.000 | -1.450% | 0.757% | 0.192% |
| 1988 | 6.900 | -1.429% | 0.636% | 0.182% |
| 1989 | 6.700 | -2.899% | 0.567% | 0.171% |
| 1990 | 6.476 | -3.343% | 0.528% | 0.163% |
| 1991 | 6.250 | -3.490% | 0.472% | 0.148% |
| 1992 | 6.010 | -3.840% | 0.456% | 0.229% |
| 1993 | 5.810 | -3.328% | 0.382% | 0.198% |
| 1994 | 5.900 | 1.549% | 0.373% | 0.196% |
| 1995 | 5.295 | -10.254% | 0.332% | 0.176% |
| 1996 | 5.295 | 0.000% | 0.332% | 0.179% |
| 1997 | 5.200 | -1.794% | 0.322% | 0.105% |
| 1998 | 5.100 | -1.923% | 0.295% | 0.100% |
| 1999 | 4.177 | -18.098% | 0.239% | 0.081% |
| 2000 | 3.875 | -7.230% | 0.222% | 0.075% |
| 2001 | 3.875 | 0.000% | 0.209% | 0.073% |
| 2002 | 3.249 | -16.155% | 0.165% | 0.060% |
| 2003 | 3.250 | 0.031% | 0.164% | 0.059% |
| 2004 | 3.250 | 0.000% | 0.129% | 0.053% |
| 2005 | 3.250 | 0.000% | 0.129% | 0.054% |
| 2006 | 3.250 | 0.000% | 0.127% | 0.053% |
| 2007 | 3.250 | 0.000% | 0.127% | 0.052% |
| 2008 | 3.250 | 0.000% | 0.128% | 0.052% |
| 2009 | 3.250 | 0.000% | 0.125% | 0.052% |
| 2010 | 3.250 | 0.000% | 0.122% | 0.049% |
| 2011 | 3.250 | 0.000% | 0.121% | 0.048% |
| 2012 | 3.250 | 0.000% | 0.116% | 0.048% |
| 2013 | 3.250 | 0.000% | 0.115% | 0.047% |
| 2014 | 3.250 | 0.000% | 0.116% | 0.047% |
| 2015 | 3.250 | 0.000% | 0.115% | 0.047% |
| 2016 | 3.250 | 0.000% | 0.115% | 0.047% |
| 2017 | 3.250 | 0.000% | 0.116% | N/A |
Historical Energy Data about Bahrain
Total Oil Supply
Total Consumption of Petroleum Products
Oil and Petroleum Products, Net Exports/Imports (-)
Production of Crude Oil including Lease Condensate
Crude Oil Proved Reserves
Dry Natural Gas Production
Dry Natural Gas Consumption
Dry Natural Gas, Net Exports/Imports (-)
Proved Reserves of Natural Gas
Coal, Net Exports/Imports (-)
Total Electricity Net Generation
Total Electricity Net Consumption
Electricity, Net Exports/Imports (-)
Total Conventional Thermal Electricity Net Generation
Total Primary Energy Production
Total Primary Energy Consumption
Total Carbon Dioxide Emissions from the Consumption of Energy
Population