| Business / Energy Data |
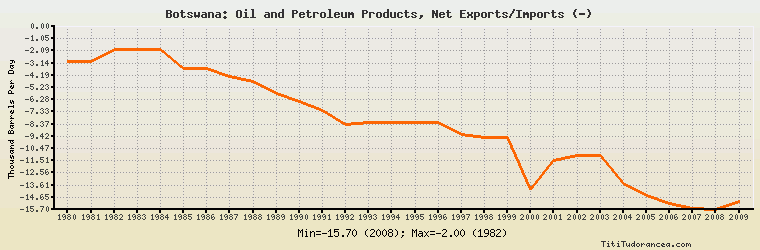
Botswana: Oil and Petroleum Products, Net Exports/Imports (-)
Thousand Barrels Per Day
| Year | Botswana | Change, percent | Botswana, percent of Africa | Botswana, percent of World |
| 1980 | -3.000 | N/A | -0.063% | N/A |
| 1981 | -3.000 | 0.000% | -0.091% | N/A |
| 1982 | -2.000 | -33.333% | -0.062% | N/A |
| 1983 | -2.000 | 0.000% | -0.062% | N/A |
| 1984 | -2.000 | 0.000% | -0.056% | N/A |
| 1985 | -3.632 | 81.600% | -0.096% | N/A |
| 1986 | -3.599 | -0.909% | -0.097% | N/A |
| 1987 | -4.257 | 18.283% | -0.116% | N/A |
| 1988 | -4.721 | 10.900% | -0.120% | N/A |
| 1989 | -5.715 | 21.055% | -0.134% | N/A |
| 1990 | -6.433 | 12.563% | -0.138% | N/A |
| 1991 | -7.216 | 12.172% | -0.149% | N/A |
| 1992 | -8.401 | 16.422% | -0.171% | N/A |
| 1993 | -8.230 | -2.035% | -0.169% | N/A |
| 1994 | -8.230 | 0.000% | -0.170% | N/A |
| 1995 | -8.230 | 0.000% | -0.163% | N/A |
| 1996 | -8.230 | 0.000% | -0.158% | N/A |
| 1997 | -9.272 | 12.661% | -0.170% | N/A |
| 1998 | -9.488 | 2.330% | -0.176% | N/A |
| 1999 | -9.488 | 0.000% | -0.180% | N/A |
| 2000 | -13.965 | 47.186% | -0.257% | N/A |
| 2001 | -11.534 | -17.408% | -0.213% | N/A |
| 2002 | -11.080 | -3.936% | -0.204% | N/A |
| 2003 | -11.080 | 0.000% | -0.189% | N/A |
| 2004 | -13.488 | 21.733% | -0.208% | N/A |
| 2005 | -14.519 | 7.644% | -0.204% | N/A |
| 2006 | -15.196 | 4.663% | -0.211% | N/A |
| 2007 | -15.590 | 2.593% | -0.210% | N/A |
| 2008 | -15.700 | 0.706% | -0.212% | N/A |
| 2009 | -15.000 | -4.459% | -0.211% | N/A |
Historical Energy Data about Botswana
Total Consumption of Petroleum Products
Oil and Petroleum Products, Net Exports/Imports (-)
Dry Natural Gas, Net Exports/Imports (-)
Total Primary Coal Production
Total Coal Consumption
Coal, Net Exports/Imports (-)
Total Recoverable Coal
Total Electricity Net Generation
Total Electricity Net Consumption
Total Electricity Imports
Electricity, Net Exports/Imports (-)
Total Conventional Thermal Electricity Net Generation
Total Primary Energy Production
Total Primary Energy Consumption
Total Carbon Dioxide Emissions from the Consumption of Energy
Population