| Business / Energy Data |
Burkina Faso: Per Capita Carbon Dioxide Emissions from the Consumption of Energy
Metric Tons of Carbon Dioxide per Person
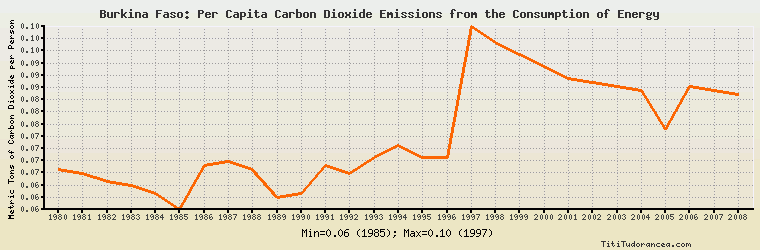
| Year | Burkina Faso | Change, percent | Burkina Faso, percent of Africa | Burkina Faso, percent of World |
| 1980 | 0.066 | N/A | N/A | 1.589% |
| 1981 | 0.065 | -1.515% | N/A | 1.612% |
| 1982 | 0.063 | -3.077% | N/A | 1.599% |
| 1983 | 0.062 | -1.587% | N/A | 1.590% |
| 1984 | 0.060 | -3.226% | N/A | 1.493% |
| 1985 | 0.056 | -6.667% | N/A | 1.385% |
| 1986 | 0.067 | 19.643% | N/A | 1.649% |
| 1987 | 0.068 | 1.493% | N/A | 1.659% |
| 1988 | 0.066 | -2.941% | N/A | 1.586% |
| 1989 | 0.059 | -10.606% | N/A | 1.421% |
| 1990 | 0.060 | 1.695% | N/A | 1.462% |
| 1991 | 0.067 | 11.667% | N/A | 1.667% |
| 1992 | 0.065 | -2.985% | N/A | 1.649% |
| 1993 | 0.069 | 6.154% | N/A | 1.758% |
| 1994 | 0.072 | 4.348% | N/A | 1.848% |
| 1995 | 0.069 | -4.167% | N/A | 1.768% |
| 1996 | 0.069 | 0.000% | N/A | 1.753% |
| 1997 | 0.102 | 47.826% | N/A | 2.580% |
| 1998 | 0.098 | -3.922% | N/A | 2.519% |
| 1999 | 0.095 | -3.061% | N/A | 2.440% |
| 2000 | 0.092 | -3.158% | N/A | 2.345% |
| 2001 | 0.089 | -3.261% | N/A | 2.281% |
| 2002 | 0.088 | -1.124% | N/A | 2.217% |
| 2003 | 0.087 | -1.136% | N/A | 2.114% |
| 2004 | 0.086 | -1.149% | N/A | 1.988% |
| 2005 | 0.076 | -11.628% | N/A | 1.725% |
| 2006 | 0.087 | 14.474% | N/A | 1.959% |
| 2007 | 0.086 | -1.149% | N/A | 1.904% |
| 2008 | 0.085 | -1.163% | N/A | 1.872% |
| 2009 | N/A | N/A | N/A | N/A |
| 2010 | N/A | N/A | N/A | N/A |
Historical Energy Data about Burkina Faso
Total Consumption of Petroleum Products
Oil and Petroleum Products, Net Exports/Imports (-)
Dry Natural Gas, Net Exports/Imports (-)
Coal, Net Exports/Imports (-)
Total Electricity Net Generation
Total Electricity Net Consumption
Electricity, Net Exports/Imports (-)
Total Conventional Thermal Electricity Net Generation
Hydroelectricity Net Generation
Total Primary Energy Production
Total Primary Energy Consumption
Total Carbon Dioxide Emissions from the Consumption of Energy
Population