| Business / Demographics |
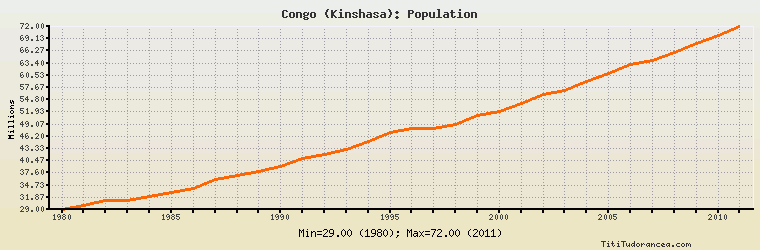
Congo (Kinshasa): Population
Millions
| Year | Congo (Kinshasa) | Change, percent | Congo (Kinshasa), percent of Africa | Congo (Kinshasa), percent of World |
| 1980 | 29.000 | N/A | 6.112% | 0.652% |
| 1981 | 30.000 | 3.448% | 6.149% | 0.663% |
| 1982 | 31.000 | 3.333% | 6.112% | 0.672% |
| 1983 | 31.000 | 0.000% | 5.967% | 0.661% |
| 1984 | 32.000 | 3.226% | 6.015% | 0.671% |
| 1985 | 33.000 | 3.125% | 6.021% | 0.680% |
| 1986 | 34.000 | 3.030% | 6.043% | 0.689% |
| 1987 | 36.000 | 5.882% | 6.223% | 0.717% |
| 1988 | 37.000 | 2.778% | 6.215% | 0.724% |
| 1989 | 38.000 | 2.703% | 6.216% | 0.732% |
| 1990 | 39.000 | 2.632% | 6.211% | 0.738% |
| 1991 | 41.000 | 5.128% | 6.373% | 0.764% |
| 1992 | 42.000 | 2.439% | 6.359% | 0.770% |
| 1993 | 43.000 | 2.381% | 6.358% | 0.777% |
| 1994 | 45.000 | 4.651% | 6.466% | 0.801% |
| 1995 | 47.000 | 4.444% | 6.579% | 0.825% |
| 1996 | 48.000 | 2.128% | 6.564% | 0.831% |
| 1997 | 48.000 | 0.000% | 6.422% | 0.820% |
| 1998 | 49.000 | 2.083% | 6.408% | 0.825% |
| 1999 | 51.000 | 4.082% | 6.500% | 0.848% |
| 2000 | 52.000 | 1.961% | 6.462% | 0.854% |
| 2001 | 54.000 | 3.846% | 6.573% | 0.876% |
| 2002 | 56.000 | 3.704% | 6.632% | 0.897% |
| 2003 | 57.000 | 1.786% | 6.593% | 0.902% |
| 2004 | 59.000 | 3.509% | 6.648% | 0.922% |
| 2005 | 61.000 | 3.390% | 6.710% | 0.944% |
| 2006 | 63.000 | 3.279% | 6.755% | 0.962% |
| 2007 | 64.000 | 1.587% | 6.719% | 0.965% |
| 2008 | 66.000 | 3.125% | 6.764% | 0.985% |
| 2009 | 68.000 | 3.030% | 6.795% | 1.002% |
| 2010 | 70.000 | 2.941% | 6.823% | 1.020% |
| 2011 | 72.000 | 2.857% | 6.835% | 1.036% |
Historical Energy Data about Congo (Kinshasa)
Total Oil Supply
Total Consumption of Petroleum Products
Oil and Petroleum Products, Net Exports/Imports (-)
Production of Crude Oil including Lease Condensate
Crude Oil Proved Reserves
Dry Natural Gas, Net Exports/Imports (-)
Proved Reserves of Natural Gas
Total Primary Coal Production
Total Coal Consumption
Coal, Net Exports/Imports (-)
Total Recoverable Coal
Total Electricity Net Generation
Total Electricity Net Consumption
Total Electricity Exports
Total Electricity Imports
Electricity, Net Exports/Imports (-)
Total Conventional Thermal Electricity Net Generation
Hydroelectricity Net Generation
Total Primary Energy Production
Total Primary Energy Consumption
Total Carbon Dioxide Emissions from the Consumption of Energy
Population