| Business / Energy Data |
Former Serbia and Montenegro: Dry Natural Gas, Net Exports/Imports (-)
Billion Cubic Feet
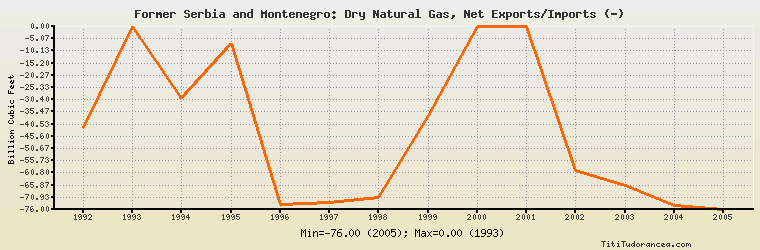
| Year | Former Serbia and Montenegro | Change, percent | Former Serbia and Montenegro, percent of Europe | Former Serbia and Montenegro, percent of World |
| 1992 | -42.000 | N/A | 0.943% | N/A |
| 1993 | 0.000 | -100.000% | 0.00% | N/A |
| 1994 | -30.000 | 0.000% | 0.649% | N/A |
| 1995 | -7.000 | -76.667% | 0.130% | N/A |
| 1996 | -74.000 | 957.143% | 1.394% | N/A |
| 1997 | -73.000 | -1.351% | 1.350% | N/A |
| 1998 | -71.000 | -2.740% | 1.209% | N/A |
| 1999 | -37.000 | -47.887% | 0.590% | N/A |
| 2000 | 0.000 | -100.000% | 0.00% | N/A |
| 2001 | 0.000 | 0.000% | 0.00% | N/A |
| 2002 | -60.000 | 0.000% | 0.884% | N/A |
| 2003 | -66.000 | 10.000% | 0.896% | N/A |
| 2004 | -74.500 | 12.879% | 0.977% | N/A |
| 2005 | -76.000 | 2.013% | 0.884% | N/A |
Historical Energy Data about Former Serbia and Montenegro
Total Oil Supply
Total Consumption of Petroleum Products
Oil and Petroleum Products, Net Exports/Imports (-)
Production of Crude Oil including Lease Condensate
Crude Oil Proved Reserves
Dry Natural Gas Production
Dry Natural Gas Consumption
Dry Natural Gas, Net Exports/Imports (-)
Proved Reserves of Natural Gas
Total Primary Coal Production
Total Coal Consumption
Coal, Net Exports/Imports (-)
Total Recoverable Coal
Total Electricity Net Generation
Total Electricity Net Consumption
Total Electricity Exports
Total Electricity Imports
Electricity, Net Exports/Imports (-)
Total Conventional Thermal Electricity Net Generation
Hydroelectricity Net Generation
Total Primary Energy Production
Total Primary Energy Consumption
Total Carbon Dioxide Emissions from the Consumption of Energy
Population