| Business / Energy Data |
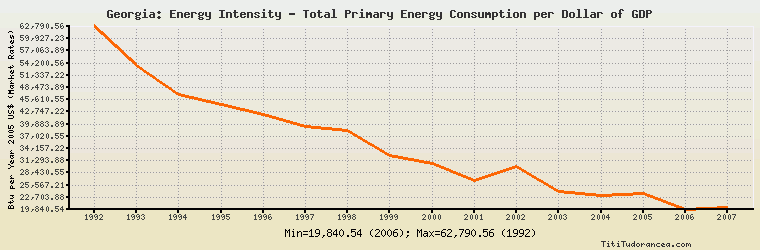
Georgia: Energy Intensity - Total Primary Energy Consumption per Dollar of GDP
Btu per Year 2005 U.S. Dollars (Market Exchange Rates)
| Year | Georgia | Change, percent | Georgia, percent of Eurasia | Georgia, percent of World |
| 1980 | N/A | N/A | N/A | N/A |
| 1981 | N/A | N/A | N/A | N/A |
| 1982 | N/A | N/A | N/A | N/A |
| 1983 | N/A | N/A | N/A | N/A |
| 1984 | N/A | N/A | N/A | N/A |
| 1985 | N/A | N/A | N/A | N/A |
| 1986 | N/A | N/A | N/A | N/A |
| 1987 | N/A | N/A | N/A | N/A |
| 1988 | N/A | N/A | N/A | N/A |
| 1989 | N/A | N/A | N/A | N/A |
| 1990 | N/A | N/A | N/A | N/A |
| 1991 | N/A | N/A | N/A | N/A |
| 1992 | 62,790.561 | N/A | 111.272% | 561.237% |
| 1993 | 53,603.382 | -14.631% | 92.051% | 480.164% |
| 1994 | 46,837.401 | -12.622% | 77.986% | 427.517% |
| 1995 | 44,490.775 | -5.010% | 73.435% | 408.956% |
| 1996 | 42,095.780 | -5.383% | 68.838% | 389.267% |
| 1997 | 39,230.083 | -6.808% | 69.327% | 370.511% |
| 1998 | 38,474.407 | -1.926% | 65.981% | 370.689% |
| 1999 | 32,588.602 | -15.298% | 57.205% | 318.467% |
| 2000 | 30,551.361 | -6.251% | 57.452% | 305.092% |
| 2001 | 26,748.893 | -12.446% | 53.258% | 269.392% |
| 2002 | 29,874.124 | 11.684% | 61.381% | 299.363% |
| 2003 | 24,086.156 | -19.375% | 51.181% | 238.949% |
| 2004 | 23,241.770 | -3.506% | 51.740% | 227.448% |
| 2005 | 23,621.633 | 1.634% | 55.180% | 232.279% |
| 2006 | 19,840.544 | -16.007% | 49.587% | 198.504% |
| 2007 | 20,341.014 | 2.522% | 58.451% | 213.398% |
| 2008 | N/A | N/A | N/A | N/A |
| 2009 | N/A | N/A | N/A | N/A |
| 2010 | N/A | N/A | N/A | N/A |
Historical Energy Data about Georgia
Total Oil Supply
Total Consumption of Petroleum Products
Oil and Petroleum Products, Net Exports/Imports (-)
Production of Crude Oil including Lease Condensate
Crude Oil Proved Reserves
Dry Natural Gas Production
Dry Natural Gas Consumption
Dry Natural Gas, Net Exports/Imports (-)
Proved Reserves of Natural Gas
Total Primary Coal Production
Total Coal Consumption
Coal, Net Exports/Imports (-)
Total Electricity Net Generation
Total Electricity Net Consumption
Total Electricity Exports
Total Electricity Imports
Electricity, Net Exports/Imports (-)
Total Conventional Thermal Electricity Net Generation
Hydroelectricity Net Generation
Total Primary Energy Production
Total Primary Energy Consumption
Total Carbon Dioxide Emissions from the Consumption of Energy
Population