| Business / Energy Data |
Ghana: Total Consumption of Petroleum Products
Thousand Barrels Per Day
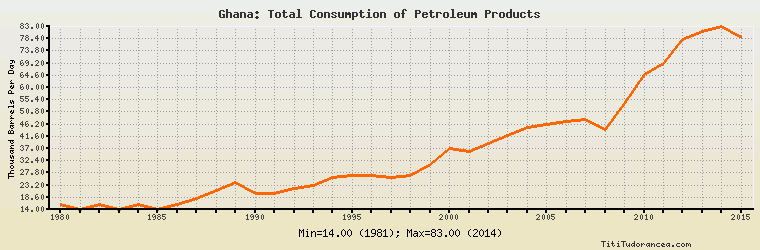
| Year | Ghana | Change, percent | Ghana, percent of Africa | Ghana, percent of World |
| 1980 | 16.000 | N/A | 1.086% | 0.025% |
| 1981 | 14.000 | -12.500% | 0.888% | 0.023% |
| 1982 | 16.000 | 14.286% | 0.964% | 0.027% |
| 1983 | 14.000 | -12.500% | 0.825% | 0.024% |
| 1984 | 16.000 | 14.286% | 0.909% | 0.027% |
| 1985 | 14.000 | -12.500% | 0.766% | 0.023% |
| 1986 | 16.000 | 14.286% | 0.879% | 0.026% |
| 1987 | 18.000 | 12.500% | 0.979% | 0.029% |
| 1988 | 21.000 | 16.667% | 1.101% | 0.032% |
| 1989 | 24.000 | 14.286% | 1.212% | 0.036% |
| 1990 | 20.000 | -16.667% | 0.967% | 0.030% |
| 1991 | 20.000 | 0.000% | 0.945% | 0.030% |
| 1992 | 22.000 | 10.000% | 1.021% | 0.033% |
| 1993 | 23.000 | 4.545% | 1.056% | 0.034% |
| 1994 | 26.000 | 13.043% | 1.190% | 0.038% |
| 1995 | 27.000 | 3.846% | 1.199% | 0.039% |
| 1996 | 27.000 | 0.000% | 1.170% | 0.038% |
| 1997 | 26.000 | -3.704% | 1.096% | 0.035% |
| 1998 | 27.000 | 3.846% | 1.123% | 0.036% |
| 1999 | 31.000 | 14.815% | 1.265% | 0.041% |
| 2000 | 37.000 | 19.355% | 1.446% | 0.048% |
| 2001 | 36.000 | -2.703% | 1.374% | 0.046% |
| 2002 | 39.000 | 8.333% | 1.440% | 0.050% |
| 2003 | 42.000 | 7.692% | 1.524% | 0.052% |
| 2004 | 45.000 | 7.143% | 1.579% | 0.054% |
| 2005 | 46.000 | 2.222% | 1.549% | 0.054% |
| 2006 | 47.000 | 2.174% | 1.562% | 0.055% |
| 2007 | 48.000 | 2.128% | 1.573% | 0.055% |
| 2008 | 44.000 | -8.333% | 1.381% | 0.051% |
| 2009 | 54.000 | 22.727% | 1.616% | 0.063% |
| 2010 | 65.000 | 20.370% | 1.845% | 0.073% |
| 2011 | 69.000 | 6.154% | 2.003% | 0.077% |
| 2012 | 78.000 | 13.043% | 2.140% | 0.086% |
| 2013 | 81.000 | 3.846% | 2.126% | 0.088% |
| 2014 | 83.000 | 2.469% | 2.081% | 0.089% |
| 2015 | 79.000 | -4.819% | 1.975% | 0.083% |
Historical Energy Data about Ghana
Total Oil Supply
Total Consumption of Petroleum Products
Oil and Petroleum Products, Net Exports/Imports (-)
Production of Crude Oil including Lease Condensate
Crude Oil Proved Reserves
Dry Natural Gas, Net Exports/Imports (-)
Proved Reserves of Natural Gas
Total Coal Consumption
Coal, Net Exports/Imports (-)
Total Electricity Net Generation
Total Electricity Net Consumption
Total Electricity Exports
Total Electricity Imports
Electricity, Net Exports/Imports (-)
Total Conventional Thermal Electricity Net Generation
Hydroelectricity Net Generation
Total Primary Energy Production
Total Primary Energy Consumption
Total Carbon Dioxide Emissions from the Consumption of Energy
Population