| Business / Energy Data |
Hawaiian Trade Zone: Oil and Petroleum Products, Net Exports/Imports (-)
Thousand Barrels Per Day
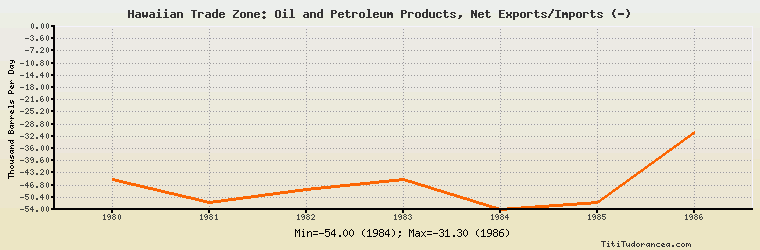
| Year | Hawaiian Trade Zone | Change, percent | Hawaiian Trade Zone, percent of Asia & Oceania | Hawaiian Trade Zone, percent of World |
| 1980 | -45.000 | N/A | 0.802% | N/A |
| 1981 | -52.000 | 15.556% | 0.932% | N/A |
| 1982 | -48.000 | -7.692% | 0.876% | N/A |
| 1983 | -45.000 | -6.250% | 0.881% | N/A |
| 1984 | -54.000 | 20.000% | 1.058% | N/A |
| 1985 | -52.075 | -3.565% | 1.101% | N/A |
| 1986 | -31.300 | -39.894% | 0.636% | N/A |
Historical Energy Data about Hawaiian Trade Zone
Total Oil Supply
Total Consumption of Petroleum Products
Oil and Petroleum Products, Net Exports/Imports (-)
Total Primary Energy Consumption
Total Carbon Dioxide Emissions from the Consumption of Energy