| Business / Demographics |
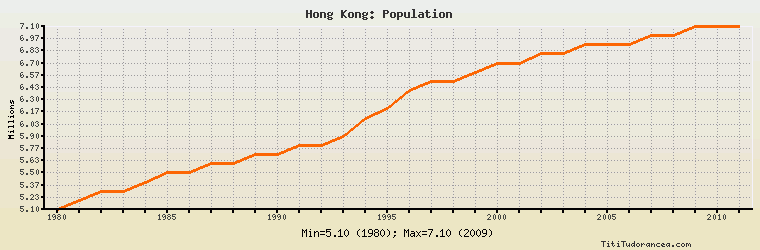
Hong Kong: Population
Millions
| Year | Hong Kong | Change, percent | Hong Kong, percent of Asia & Oceania | Hong Kong, percent of World |
| 1980 | 5.100 | N/A | 0.206% | 0.115% |
| 1981 | 5.200 | 1.961% | 0.206% | 0.115% |
| 1982 | 5.300 | 1.923% | 0.207% | 0.115% |
| 1983 | 5.300 | 0.000% | 0.203% | 0.113% |
| 1984 | 5.400 | 1.887% | 0.203% | 0.113% |
| 1985 | 5.500 | 1.852% | 0.203% | 0.113% |
| 1986 | 5.500 | 0.000% | 0.200% | 0.111% |
| 1987 | 5.600 | 1.818% | 0.200% | 0.111% |
| 1988 | 5.600 | 0.000% | 0.196% | 0.110% |
| 1989 | 5.700 | 1.786% | 0.196% | 0.110% |
| 1990 | 5.700 | 0.000% | 0.193% | 0.108% |
| 1991 | 5.800 | 1.754% | 0.193% | 0.108% |
| 1992 | 5.800 | 0.000% | 0.190% | 0.106% |
| 1993 | 5.900 | 1.724% | 0.190% | 0.107% |
| 1994 | 6.100 | 3.390% | 0.194% | 0.109% |
| 1995 | 6.200 | 1.639% | 0.194% | 0.109% |
| 1996 | 6.400 | 3.226% | 0.198% | 0.111% |
| 1997 | 6.500 | 1.562% | 0.198% | 0.111% |
| 1998 | 6.500 | 0.000% | 0.195% | 0.109% |
| 1999 | 6.600 | 1.538% | 0.196% | 0.110% |
| 2000 | 6.700 | 1.515% | 0.197% | 0.110% |
| 2001 | 6.700 | 0.000% | 0.194% | 0.109% |
| 2002 | 6.800 | 1.493% | 0.195% | 0.109% |
| 2003 | 6.800 | 0.000% | 0.193% | 0.108% |
| 2004 | 6.900 | 1.471% | 0.193% | 0.108% |
| 2005 | 6.900 | 0.000% | 0.191% | 0.107% |
| 2006 | 6.900 | 0.000% | 0.189% | 0.105% |
| 2007 | 7.000 | 1.449% | 0.190% | 0.106% |
| 2008 | 7.000 | 0.000% | 0.188% | 0.104% |
| 2009 | 7.100 | 1.429% | 0.189% | 0.105% |
| 2010 | 7.100 | 0.000% | 0.187% | 0.103% |
| 2011 | 7.100 | 0.000% | 0.185% | 0.102% |
Historical Energy Data about Hong Kong
Total Consumption of Petroleum Products
Oil and Petroleum Products, Net Exports/Imports (-)
Dry Natural Gas Consumption
Dry Natural Gas, Net Exports/Imports (-)
Total Coal Consumption
Coal, Net Exports/Imports (-)
Total Electricity Net Generation
Total Electricity Net Consumption
Total Electricity Exports
Total Electricity Imports
Electricity, Net Exports/Imports (-)
Total Conventional Thermal Electricity Net Generation
Wind Electricity Net Generation
Total Primary Energy Consumption
Total Carbon Dioxide Emissions from the Consumption of Energy
Population