| Business / Energy Data |
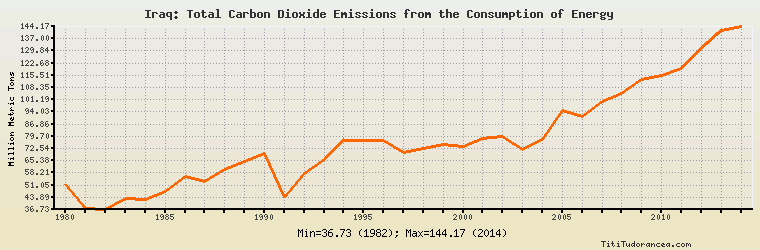
Iraq: Total Carbon Dioxide Emissions from the Consumption of Energy
Million Metric Tons
| Year | Iraq | Change, percent | Iraq, percent of Middle East | Iraq, percent of World |
| 1980 | 51.648 | N/A | 10.504% | 0.281% |
| 1981 | 37.291 | -27.798% | 7.971% | 0.206% |
| 1982 | 36.727 | -1.512% | 7.536% | 0.203% |
| 1983 | 43.135 | 17.448% | 8.124% | 0.237% |
| 1984 | 42.554 | -1.347% | 7.661% | 0.224% |
| 1985 | 47.121 | 10.732% | 8.169% | 0.243% |
| 1986 | 56.178 | 19.221% | 9.059% | 0.284% |
| 1987 | 53.084 | -5.507% | 8.223% | 0.261% |
| 1988 | 60.127 | 13.268% | 8.872% | 0.286% |
| 1989 | 64.674 | 7.562% | 9.115% | 0.303% |
| 1990 | 69.558 | 7.552% | 9.574% | 0.320% |
| 1991 | 43.709 | -37.162% | 5.589% | 0.205% |
| 1992 | 57.788 | 32.211% | 7.112% | 0.274% |
| 1993 | 66.097 | 14.378% | 7.922% | 0.311% |
| 1994 | 77.317 | 16.975% | 8.825% | 0.361% |
| 1995 | 77.317 | 0.000% | 8.618% | 0.352% |
| 1996 | 77.476 | 0.206% | 8.332% | 0.346% |
| 1997 | 69.925 | -9.746% | 7.119% | 0.311% |
| 1998 | 72.260 | 3.339% | 7.131% | 0.321% |
| 1999 | 75.011 | 3.807% | 7.139% | 0.328% |
| 2000 | 73.905 | -1.474% | 6.789% | 0.313% |
| 2001 | 78.162 | 5.760% | 7.010% | 0.328% |
| 2002 | 79.367 | 1.542% | 6.787% | 0.325% |
| 2003 | 71.981 | -9.306% | 5.819% | 0.281% |
| 2004 | 77.980 | 8.334% | 5.879% | 0.291% |
| 2005 | 94.764 | 21.523% | 6.577% | 0.340% |
| 2006 | 91.125 | -3.840% | 6.105% | 0.318% |
| 2007 | 99.995 | 9.734% | 6.545% | 0.340% |
| 2008 | 104.655 | 4.660% | 6.435% | 0.352% |
| 2009 | 112.920 | 7.897% | 6.491% | 0.382% |
| 2010 | 115.333 | 2.137% | 6.229% | 0.370% |
| 2011 | 119.766 | 3.844% | 6.155% | 0.370% |
| 2012 | 131.101 | 9.464% | 6.446% | 0.396% |
| 2013 | 141.983 | 8.300% | 7.023% | 0.421% |
| 2014 | 144.165 | 1.537% | 6.903% | 0.427% |
Historical Energy Data about Iraq
Total Oil Supply
Total Consumption of Petroleum Products
Oil and Petroleum Products, Net Exports/Imports (-)
Production of Crude Oil including Lease Condensate
Crude Oil Proved Reserves
Dry Natural Gas Production
Dry Natural Gas Consumption
Dry Natural Gas, Net Exports/Imports (-)
Proved Reserves of Natural Gas
Total Coal Consumption
Coal, Net Exports/Imports (-)
Total Electricity Net Generation
Total Electricity Net Consumption
Total Electricity Imports
Electricity, Net Exports/Imports (-)
Total Conventional Thermal Electricity Net Generation
Hydroelectricity Net Generation
Total Primary Energy Production
Total Primary Energy Consumption
Total Carbon Dioxide Emissions from the Consumption of Energy
Population