| Business / Energy Data |
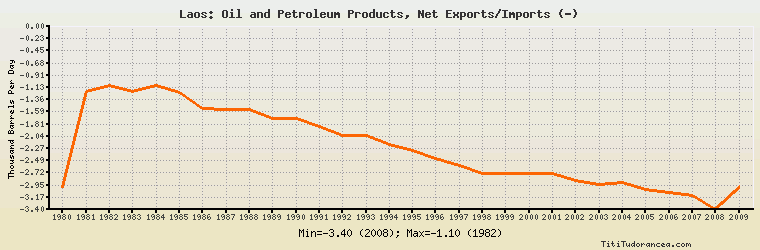
Laos: Oil and Petroleum Products, Net Exports/Imports (-)
Thousand Barrels Per Day
| Year | Laos | Change, percent | Laos, percent of Asia & Oceania | Laos, percent of World |
| 1980 | -3.000 | N/A | 0.053% | N/A |
| 1981 | -1.200 | -60.000% | 0.022% | N/A |
| 1982 | -1.100 | -8.333% | 0.020% | N/A |
| 1983 | -1.200 | 9.091% | 0.023% | N/A |
| 1984 | -1.100 | -8.333% | 0.022% | N/A |
| 1985 | -1.233 | 12.091% | 0.026% | N/A |
| 1986 | -1.521 | 23.358% | 0.031% | N/A |
| 1987 | -1.540 | 1.249% | 0.029% | N/A |
| 1988 | -1.536 | -0.260% | 0.025% | N/A |
| 1989 | -1.701 | 10.742% | 0.026% | N/A |
| 1990 | -1.701 | 0.000% | 0.024% | N/A |
| 1991 | -1.862 | 9.465% | 0.025% | N/A |
| 1992 | -2.018 | 8.378% | 0.024% | N/A |
| 1993 | -2.023 | 0.248% | 0.023% | N/A |
| 1994 | -2.185 | 8.008% | 0.022% | N/A |
| 1995 | -2.300 | 5.263% | 0.022% | N/A |
| 1996 | -2.454 | 6.696% | 0.022% | N/A |
| 1997 | -2.576 | 4.971% | 0.022% | N/A |
| 1998 | -2.737 | 6.250% | 0.024% | N/A |
| 1999 | -2.737 | 0.000% | 0.022% | N/A |
| 2000 | -2.729 | -0.292% | 0.022% | N/A |
| 2001 | -2.737 | 0.293% | 0.022% | N/A |
| 2002 | -2.852 | 4.202% | 0.022% | N/A |
| 2003 | -2.939 | 3.050% | 0.021% | N/A |
| 2004 | -2.898 | -1.395% | 0.019% | N/A |
| 2005 | -3.036 | 4.762% | 0.019% | N/A |
| 2006 | -3.080 | 1.449% | 0.019% | N/A |
| 2007 | -3.134 | 1.753% | 0.019% | N/A |
| 2008 | -3.400 | 8.488% | 0.021% | N/A |
| 2009 | -3.000 | -11.765% | 0.017% | N/A |
Historical Energy Data about Laos
Total Consumption of Petroleum Products
Oil and Petroleum Products, Net Exports/Imports (-)
Dry Natural Gas, Net Exports/Imports (-)
Total Primary Coal Production
Total Coal Consumption
Coal, Net Exports/Imports (-)
Total Electricity Net Generation
Total Electricity Net Consumption
Total Electricity Exports
Total Electricity Imports
Electricity, Net Exports/Imports (-)
Total Conventional Thermal Electricity Net Generation
Hydroelectricity Net Generation
Total Primary Energy Production
Total Primary Energy Consumption
Total Carbon Dioxide Emissions from the Consumption of Energy
Population