| Business / Energy Data |
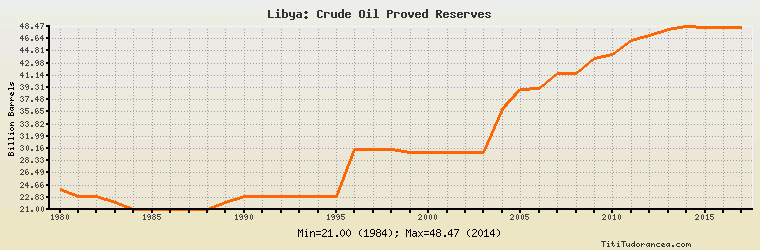
Libya: Crude Oil Proved Reserves
Billion Barrels
| Year | Libya | Change, percent | Libya, percent of Africa | Libya, percent of World |
| 1980 | 24.000 | N/A | 42.026% | 3.740% |
| 1981 | 23.000 | -4.167% | 41.441% | 3.532% |
| 1982 | 23.000 | 0.000% | 40.280% | 3.434% |
| 1983 | 22.000 | -4.348% | 37.607% | 3.306% |
| 1984 | 21.000 | -4.545% | 37.300% | 3.147% |
| 1985 | 21.000 | 0.000% | 37.634% | 2.995% |
| 1986 | 21.000 | 0.000% | 36.907% | 3.006% |
| 1987 | 21.000 | 0.000% | 38.391% | 3.006% |
| 1988 | 21.000 | 0.000% | 38.113% | 2.361% |
| 1989 | 22.000 | 4.762% | 38.732% | 2.423% |
| 1990 | 23.000 | 4.545% | 39.049% | 2.296% |
| 1991 | 23.000 | 0.000% | 38.397% | 2.300% |
| 1992 | 23.000 | 0.000% | 37.891% | 2.465% |
| 1993 | 23.000 | 0.000% | 37.037% | 2.447% |
| 1994 | 23.000 | 0.000% | 37.037% | 2.441% |
| 1995 | 23.000 | 0.000% | 36.918% | 2.439% |
| 1996 | 30.000 | 30.435% | 40.706% | 3.152% |
| 1997 | 30.000 | 0.000% | 43.860% | 2.937% |
| 1998 | 30.000 | 0.000% | 42.433% | 2.931% |
| 1999 | 29.500 | -1.667% | 39.103% | 2.853% |
| 2000 | 29.500 | 0.000% | 39.391% | 2.897% |
| 2001 | 29.500 | 0.000% | 39.392% | 2.865% |
| 2002 | 29.500 | 0.000% | 38.473% | 2.855% |
| 2003 | 29.500 | 0.000% | 38.099% | 2.429% |
| 2004 | 36.000 | 22.034% | 41.359% | 2.843% |
| 2005 | 39.000 | 8.333% | 38.697% | 3.051% |
| 2006 | 39.126 | 0.323% | 38.142% | 3.035% |
| 2007 | 41.464 | 5.976% | 36.349% | 3.141% |
| 2008 | 41.464 | 0.000% | 36.107% | 3.121% |
| 2009 | 43.660 | 5.296% | 37.296% | 3.267% |
| 2010 | 44.270 | 1.397% | 37.166% | 3.263% |
| 2011 | 46.420 | 4.857% | 37.554% | 3.147% |
| 2012 | 47.100 | 1.465% | 37.920% | 3.092% |
| 2013 | 48.010 | 1.932% | 37.584% | 2.921% |
| 2014 | 48.470 | 0.958% | 38.247% | 2.937% |
| 2015 | 48.363 | -0.221% | 38.231% | 2.917% |
| 2016 | 48.363 | 0.000% | 38.409% | 2.930% |
| 2017 | 48.363 | 0.000% | 38.458% | N/A |
Historical Energy Data about Libya
Total Oil Supply
Total Consumption of Petroleum Products
Oil and Petroleum Products, Net Exports/Imports (-)
Production of Crude Oil including Lease Condensate
Crude Oil Proved Reserves
Dry Natural Gas Production
Dry Natural Gas Consumption
Dry Natural Gas, Net Exports/Imports (-)
Proved Reserves of Natural Gas
Total Coal Consumption
Coal, Net Exports/Imports (-)
Total Electricity Net Generation
Total Electricity Net Consumption
Total Electricity Exports
Total Electricity Imports
Electricity, Net Exports/Imports (-)
Total Conventional Thermal Electricity Net Generation
Total Primary Energy Production
Total Primary Energy Consumption
Total Carbon Dioxide Emissions from the Consumption of Energy
Population