| Business / Energy Data |
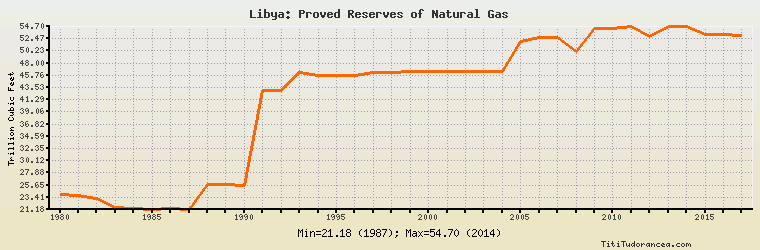
Libya: Proved Reserves of Natural Gas
Trillion Cubic Feet
| Year | Libya | Change, percent | Libya, percent of Africa | Libya, percent of World |
| 1980 | 24.000 | N/A | 11.364% | 0.928% |
| 1981 | 23.800 | -0.833% | 11.105% | 0.899% |
| 1982 | 23.200 | -2.521% | 10.901% | 0.794% |
| 1983 | 21.500 | -7.328% | 11.261% | 0.709% |
| 1984 | 21.350 | -0.698% | 11.024% | 0.667% |
| 1985 | 21.200 | -0.703% | 11.088% | 0.623% |
| 1986 | 21.390 | 0.896% | 10.519% | 0.614% |
| 1987 | 21.180 | -0.982% | 10.074% | 0.582% |
| 1988 | 25.700 | 21.341% | 10.077% | 0.678% |
| 1989 | 25.700 | 0.000% | 9.999% | 0.655% |
| 1990 | 25.500 | -0.778% | 9.392% | 0.641% |
| 1991 | 43.000 | 68.627% | 14.836% | 1.020% |
| 1992 | 43.000 | 0.000% | 13.827% | 1.637% |
| 1993 | 46.200 | 7.442% | 13.283% | 1.571% |
| 1994 | 45.800 | -0.866% | 13.327% | 1.518% |
| 1995 | 45.800 | 0.000% | 13.406% | 1.525% |
| 1996 | 45.800 | 0.000% | 13.688% | 1.548% |
| 1997 | 46.300 | 1.092% | 14.084% | 0.936% |
| 1998 | 46.300 | 0.000% | 13.276% | 0.910% |
| 1999 | 46.400 | 0.216% | 12.843% | 0.902% |
| 2000 | 46.400 | 0.000% | 11.766% | 0.901% |
| 2001 | 46.400 | 0.000% | 11.766% | 0.877% |
| 2002 | 46.400 | 0.000% | 11.744% | 0.850% |
| 2003 | 46.400 | 0.000% | 11.089% | 0.843% |
| 2004 | 46.400 | 0.000% | 10.226% | 0.763% |
| 2005 | 52.000 | 12.069% | 10.906% | 0.860% |
| 2006 | 52.650 | 1.250% | 10.831% | 0.860% |
| 2007 | 52.650 | 0.000% | 10.842% | 0.850% |
| 2008 | 50.100 | -4.843% | 10.210% | 0.806% |
| 2009 | 54.380 | 8.543% | 10.988% | 0.868% |
| 2010 | 54.362 | -0.033% | 10.961% | 0.819% |
| 2011 | 54.680 | 0.585% | 10.549% | 0.815% |
| 2012 | 52.795 | -3.447% | 10.349% | 0.775% |
| 2013 | 54.630 | 3.476% | 10.614% | 0.798% |
| 2014 | 54.701 | 0.130% | 9.029% | 0.785% |
| 2015 | 53.183 | -2.775% | 8.803% | 0.765% |
| 2016 | 53.148 | -0.066% | 8.781% | 0.773% |
| 2017 | 53.144 | -0.008% | 8.692% | N/A |
Historical Energy Data about Libya
Total Oil Supply
Total Consumption of Petroleum Products
Oil and Petroleum Products, Net Exports/Imports (-)
Production of Crude Oil including Lease Condensate
Crude Oil Proved Reserves
Dry Natural Gas Production
Dry Natural Gas Consumption
Dry Natural Gas, Net Exports/Imports (-)
Proved Reserves of Natural Gas
Total Coal Consumption
Coal, Net Exports/Imports (-)
Total Electricity Net Generation
Total Electricity Net Consumption
Total Electricity Exports
Total Electricity Imports
Electricity, Net Exports/Imports (-)
Total Conventional Thermal Electricity Net Generation
Total Primary Energy Production
Total Primary Energy Consumption
Total Carbon Dioxide Emissions from the Consumption of Energy
Population