| Business / Energy Data |
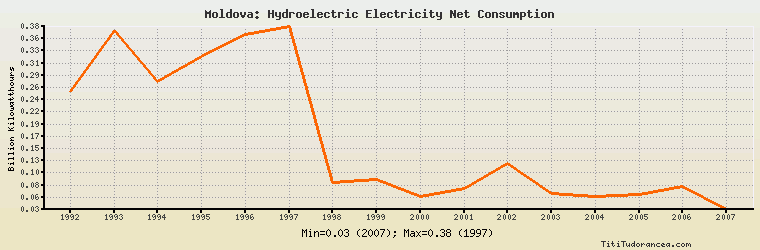
Moldova: Hydroelectric Electricity Net Consumption
Billion Kilowatthours
| Year | Moldova | Change, percent | Moldova, percent of Eurasia | Moldova, percent of World |
| 1980 | N/A | N/A | N/A | N/A |
| 1981 | N/A | N/A | N/A | N/A |
| 1982 | N/A | N/A | N/A | N/A |
| 1983 | N/A | N/A | N/A | N/A |
| 1984 | N/A | N/A | N/A | N/A |
| 1985 | N/A | N/A | N/A | N/A |
| 1986 | N/A | N/A | N/A | N/A |
| 1987 | N/A | N/A | N/A | N/A |
| 1988 | N/A | N/A | N/A | N/A |
| 1989 | N/A | N/A | N/A | N/A |
| 1990 | N/A | N/A | N/A | N/A |
| 1991 | N/A | N/A | N/A | N/A |
| 1992 | 0.255 | N/A | 0.111% | 0.012% |
| 1993 | 0.371 | 45.490% | 0.154% | 0.016% |
| 1994 | 0.275 | -25.876% | 0.112% | 0.012% |
| 1995 | 0.321 | 16.727% | 0.136% | 0.013% |
| 1996 | 0.362 | 12.773% | 0.170% | 0.015% |
| 1997 | 0.378 | 4.420% | 0.177% | 0.015% |
| 1998 | 0.083 | -78.042% | 0.037% | 0.003% |
| 1999 | 0.090 | 8.434% | 0.040% | 0.003% |
| 2000 | 0.057 | -36.667% | 0.025% | 0.002% |
| 2001 | 0.072 | 26.316% | 0.031% | 0.003% |
| 2002 | 0.120 | 66.667% | 0.053% | 0.005% |
| 2003 | 0.063 | -47.500% | 0.028% | 0.002% |
| 2004 | 0.058 | -7.937% | 0.024% | 0.002% |
| 2005 | 0.062 | 6.897% | 0.026% | 0.002% |
| 2006 | 0.076 | 22.581% | 0.031% | 0.003% |
| 2007 | 0.033 | -56.579% | 0.013% | 0.001% |
| 2008 | N/A | N/A | N/A | N/A |
| 2009 | N/A | N/A | N/A | N/A |
| 2010 | N/A | N/A | N/A | N/A |
Historical Energy Data about Moldova
Total Consumption of Petroleum Products
Oil and Petroleum Products, Net Exports/Imports (-)
Dry Natural Gas Production
Dry Natural Gas Consumption
Dry Natural Gas, Net Exports/Imports (-)
Total Primary Coal Production
Total Coal Consumption
Coal, Net Exports/Imports (-)
Total Electricity Net Generation
Total Electricity Net Consumption
Total Electricity Exports
Total Electricity Imports
Electricity, Net Exports/Imports (-)
Total Conventional Thermal Electricity Net Generation
Hydroelectricity Net Generation
Total Primary Energy Production
Total Primary Energy Consumption
Total Carbon Dioxide Emissions from the Consumption of Energy
Population