| Business / Demographics |
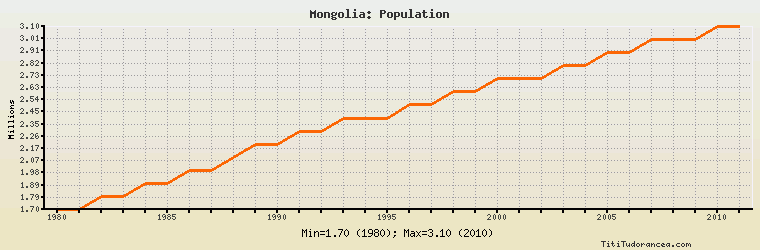
Mongolia: Population
Millions
| Year | Mongolia | Change, percent | Mongolia, percent of Asia & Oceania | Mongolia, percent of World |
| 1980 | 1.700 | N/A | 0.069% | 0.038% |
| 1981 | 1.700 | 0.000% | 0.067% | 0.038% |
| 1982 | 1.800 | 5.882% | 0.070% | 0.039% |
| 1983 | 1.800 | 0.000% | 0.069% | 0.038% |
| 1984 | 1.900 | 5.556% | 0.072% | 0.040% |
| 1985 | 1.900 | 0.000% | 0.070% | 0.039% |
| 1986 | 2.000 | 5.263% | 0.073% | 0.041% |
| 1987 | 2.000 | 0.000% | 0.071% | 0.040% |
| 1988 | 2.100 | 5.000% | 0.074% | 0.041% |
| 1989 | 2.200 | 4.762% | 0.076% | 0.042% |
| 1990 | 2.200 | 0.000% | 0.075% | 0.042% |
| 1991 | 2.300 | 4.545% | 0.077% | 0.043% |
| 1992 | 2.300 | 0.000% | 0.075% | 0.042% |
| 1993 | 2.400 | 4.348% | 0.077% | 0.043% |
| 1994 | 2.400 | 0.000% | 0.076% | 0.043% |
| 1995 | 2.400 | 0.000% | 0.075% | 0.042% |
| 1996 | 2.500 | 4.167% | 0.077% | 0.043% |
| 1997 | 2.500 | 0.000% | 0.076% | 0.043% |
| 1998 | 2.600 | 4.000% | 0.078% | 0.044% |
| 1999 | 2.600 | 0.000% | 0.077% | 0.043% |
| 2000 | 2.700 | 3.846% | 0.079% | 0.044% |
| 2001 | 2.700 | 0.000% | 0.078% | 0.044% |
| 2002 | 2.700 | 0.000% | 0.077% | 0.043% |
| 2003 | 2.800 | 3.704% | 0.079% | 0.044% |
| 2004 | 2.800 | 0.000% | 0.078% | 0.044% |
| 2005 | 2.900 | 3.571% | 0.080% | 0.045% |
| 2006 | 2.900 | 0.000% | 0.080% | 0.044% |
| 2007 | 3.000 | 3.448% | 0.081% | 0.045% |
| 2008 | 3.000 | 0.000% | 0.081% | 0.045% |
| 2009 | 3.000 | 0.000% | 0.080% | 0.044% |
| 2010 | 3.100 | 3.333% | 0.082% | 0.045% |
| 2011 | 3.100 | 0.000% | 0.081% | 0.045% |
Historical Energy Data about Mongolia
Total Consumption of Petroleum Products
Oil and Petroleum Products, Net Exports/Imports (-)
Dry Natural Gas, Net Exports/Imports (-)
Total Primary Coal Production
Total Coal Consumption
Coal, Net Exports/Imports (-)
Total Electricity Net Generation
Total Electricity Net Consumption
Total Electricity Exports
Total Electricity Imports
Electricity, Net Exports/Imports (-)
Total Conventional Thermal Electricity Net Generation
Total Primary Energy Production
Total Primary Energy Consumption
Total Carbon Dioxide Emissions from the Consumption of Energy
Population