| Business / Energy Data |
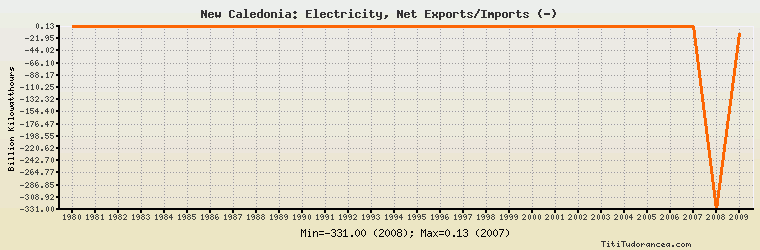
New Caledonia: Electricity, Net Exports/Imports (-)
Billion Kilowatthours
| Year | New Caledonia | Change, percent | New Caledonia, percent of Asia & Oceania | New Caledonia, percent of World |
| 1980 | 0.093 | N/A | -23.250% | N/A |
| 1981 | 0.082 | -11.828% | -19.204% | N/A |
| 1982 | 0.064 | -21.951% | -7.711% | N/A |
| 1983 | 0.049 | -23.438% | -6.622% | N/A |
| 1984 | 0.061 | 24.490% | -13.927% | N/A |
| 1985 | 0.075 | 22.951% | -23.077% | N/A |
| 1986 | 0.074 | -1.333% | -92.500% | N/A |
| 1987 | 0.067 | -9.459% | 93.056% | N/A |
| 1988 | 0.080 | 19.403% | 114.286% | N/A |
| 1989 | 0.080 | 0.000% | 20.888% | N/A |
| 1990 | 0.077 | -3.750% | 366.667% | N/A |
| 1991 | 0.078 | 1.299% | - | N/A |
| 1992 | 0.078 | 0.000% | - | N/A |
| 1993 | 0.078 | 0.000% | -312.000% | N/A |
| 1994 | 0.086 | 10.256% | - | N/A |
| 1995 | 0.110 | 27.907% | -83.969% | N/A |
| 1996 | 0.099 | -10.000% | -183.333% | N/A |
| 1997 | 0.101 | 2.020% | 78.295% | N/A |
| 1998 | 0.106 | 4.950% | -74.126% | N/A |
| 1999 | 0.108 | 1.887% | 568.421% | N/A |
| 2000 | 0.109 | 0.926% | 191.228% | N/A |
| 2001 | 0.115 | 5.505% | -244.681% | N/A |
| 2002 | 0.116 | 0.870% | 40.559% | N/A |
| 2003 | 0.116 | 0.000% | -4.498% | N/A |
| 2004 | 0.111 | -4.310% | -2.602% | N/A |
| 2005 | 0.124 | 11.712% | -17.175% | N/A |
| 2006 | 0.126 | 1.613% | -7.895% | N/A |
| 2007 | 0.128 | 1.587% | -8.410% | N/A |
| 2008 | -331.000 | -258,693.750% | 25,981.162% | N/A |
| 2009 | -13.000 | -96.073% | 279.330% | N/A |
Historical Energy Data about New Caledonia
Total Consumption of Petroleum Products
Oil and Petroleum Products, Net Exports/Imports (-)
Dry Natural Gas, Net Exports/Imports (-)
Total Coal Consumption
Coal, Net Exports/Imports (-)
Total Recoverable Coal
Total Electricity Net Generation
Total Electricity Net Consumption
Electricity, Net Exports/Imports (-)
Total Conventional Thermal Electricity Net Generation
Hydroelectricity Net Generation
Total Primary Energy Production
Total Primary Energy Consumption
Total Carbon Dioxide Emissions from the Consumption of Energy
Population