| Business / Energy Data |
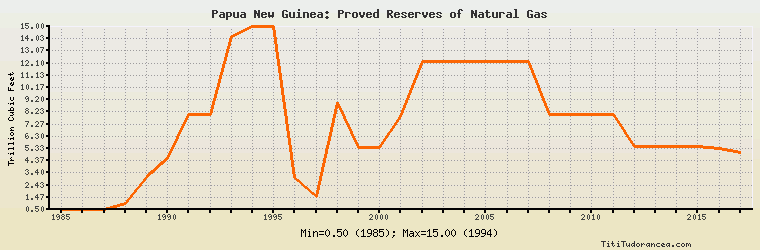
Papua New Guinea: Proved Reserves of Natural Gas
Trillion Cubic Feet
| Year | Papua New Guinea | Change, percent | Papua New Guinea, percent of Asia & Oceania | Papua New Guinea, percent of World |
| 1980 | N/A | N/A | N/A | N/A |
| 1981 | N/A | N/A | N/A | N/A |
| 1982 | N/A | N/A | N/A | N/A |
| 1983 | N/A | N/A | N/A | N/A |
| 1984 | N/A | N/A | N/A | N/A |
| 1985 | 0.500 | N/A | 0.251% | 0.015% |
| 1986 | 0.500 | 0.000% | 0.245% | 0.014% |
| 1987 | 0.500 | 0.000% | 0.217% | 0.014% |
| 1988 | 1.000 | 100.000% | 0.388% | 0.026% |
| 1989 | 3.030 | 203.000% | 1.098% | 0.077% |
| 1990 | 4.520 | 49.175% | 1.576% | 0.114% |
| 1991 | 8.000 | 76.991% | 2.648% | 0.190% |
| 1992 | 8.000 | 0.000% | 2.673% | 0.305% |
| 1993 | 14.200 | 77.500% | 4.164% | 0.483% |
| 1994 | 15.000 | 5.634% | 4.231% | 0.497% |
| 1995 | 15.000 | 0.000% | 4.278% | 0.499% |
| 1996 | 3.000 | -80.000% | 0.913% | 0.101% |
| 1997 | 1.500 | -50.000% | 0.466% | 0.030% |
| 1998 | 9.000 | 500.000% | 2.808% | 0.177% |
| 1999 | 5.442 | -39.533% | 1.513% | 0.106% |
| 2000 | 5.442 | 0.000% | 1.497% | 0.106% |
| 2001 | 7.900 | 45.167% | 2.164% | 0.149% |
| 2002 | 12.230 | 54.810% | 2.822% | 0.224% |
| 2003 | 12.230 | 0.000% | 2.746% | 0.222% |
| 2004 | 12.200 | -0.245% | 2.741% | 0.201% |
| 2005 | 12.200 | 0.000% | 3.157% | 0.202% |
| 2006 | 12.200 | 0.000% | 3.114% | 0.199% |
| 2007 | 12.200 | 0.000% | 2.908% | 0.197% |
| 2008 | 8.000 | -34.426% | 1.925% | 0.129% |
| 2009 | 8.000 | 0.000% | 1.859% | 0.128% |
| 2010 | 8.000 | 0.000% | 1.485% | 0.121% |
| 2011 | 8.000 | 0.000% | 1.488% | 0.119% |
| 2012 | 5.483 | -31.463% | 1.086% | 0.081% |
| 2013 | 5.483 | 0.000% | 1.051% | 0.080% |
| 2014 | 5.483 | 0.000% | 1.015% | 0.079% |
| 2015 | 5.467 | -0.292% | 1.116% | 0.079% |
| 2016 | 5.343 | -2.268% | 1.088% | 0.078% |
| 2017 | 4.996 | -6.494% | 0.923% | N/A |
Historical Energy Data about Papua New Guinea
Total Oil Supply
Total Consumption of Petroleum Products
Oil and Petroleum Products, Net Exports/Imports (-)
Production of Crude Oil including Lease Condensate
Crude Oil Proved Reserves
Dry Natural Gas Production
Dry Natural Gas Consumption
Dry Natural Gas, Net Exports/Imports (-)
Proved Reserves of Natural Gas
Total Coal Consumption
Coal, Net Exports/Imports (-)
Total Electricity Net Generation
Total Electricity Net Consumption
Electricity, Net Exports/Imports (-)
Total Conventional Thermal Electricity Net Generation
Hydroelectricity Net Generation
Total Primary Energy Production
Total Primary Energy Consumption
Total Carbon Dioxide Emissions from the Consumption of Energy
Population