| Business / Energy Data |
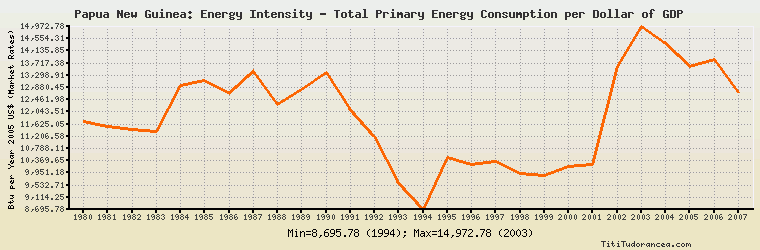
Papua New Guinea: Energy Intensity - Total Primary Energy Consumption per Dollar of GDP
Btu per Year 2005 U.S. Dollars (Market Exchange Rates)
| Year | Papua New Guinea | Change, percent | Papua New Guinea, percent of Asia & Oceania | Papua New Guinea, percent of World |
| 1980 | 11,726.374 | N/A | 96.039% | N/A |
| 1981 | 11,552.412 | -1.484% | 96.781% | N/A |
| 1982 | 11,432.316 | -1.040% | 97.260% | N/A |
| 1983 | 11,382.250 | -0.438% | 96.948% | N/A |
| 1984 | 12,956.294 | 13.829% | 106.778% | N/A |
| 1985 | 13,120.315 | 1.266% | 108.880% | N/A |
| 1986 | 12,674.106 | -3.401% | 105.277% | N/A |
| 1987 | 13,437.815 | 6.026% | 112.051% | N/A |
| 1988 | 12,298.242 | -8.480% | 102.255% | N/A |
| 1989 | 12,805.842 | 4.127% | 108.418% | N/A |
| 1990 | 13,381.669 | 4.497% | 114.845% | N/A |
| 1991 | 12,128.555 | -9.364% | 103.842% | 106.537% |
| 1992 | 11,198.566 | -7.668% | 95.743% | 100.095% |
| 1993 | 9,637.519 | -13.940% | 80.440% | 86.330% |
| 1994 | 8,695.781 | -9.772% | 70.677% | 79.372% |
| 1995 | 10,488.781 | 20.619% | 85.071% | 96.412% |
| 1996 | 10,227.568 | -2.490% | 84.642% | 94.576% |
| 1997 | 10,326.237 | 0.965% | 84.290% | 97.527% |
| 1998 | 9,922.656 | -3.908% | 81.364% | 95.602% |
| 1999 | 9,855.325 | -0.679% | 81.179% | 96.310% |
| 2000 | 10,176.875 | 3.263% | 86.172% | 101.628% |
| 2001 | 10,236.218 | 0.583% | 85.964% | 103.090% |
| 2002 | 13,601.082 | 32.872% | 111.358% | 136.294% |
| 2003 | 14,972.780 | 10.085% | 118.646% | 148.539% |
| 2004 | 14,386.846 | -3.913% | 107.083% | 140.792% |
| 2005 | 13,601.003 | -5.462% | 100.536% | 133.743% |
| 2006 | 13,828.916 | 1.676% | 102.725% | 138.358% |
| 2007 | 12,711.360 | -8.081% | 100.105% | 133.355% |
| 2008 | N/A | N/A | N/A | N/A |
| 2009 | N/A | N/A | N/A | N/A |
| 2010 | N/A | N/A | N/A | N/A |
Historical Energy Data about Papua New Guinea
Total Oil Supply
Total Consumption of Petroleum Products
Oil and Petroleum Products, Net Exports/Imports (-)
Production of Crude Oil including Lease Condensate
Crude Oil Proved Reserves
Dry Natural Gas Production
Dry Natural Gas Consumption
Dry Natural Gas, Net Exports/Imports (-)
Proved Reserves of Natural Gas
Total Coal Consumption
Coal, Net Exports/Imports (-)
Total Electricity Net Generation
Total Electricity Net Consumption
Electricity, Net Exports/Imports (-)
Total Conventional Thermal Electricity Net Generation
Hydroelectricity Net Generation
Total Primary Energy Production
Total Primary Energy Consumption
Total Carbon Dioxide Emissions from the Consumption of Energy
Population