| Business / Energy Data |
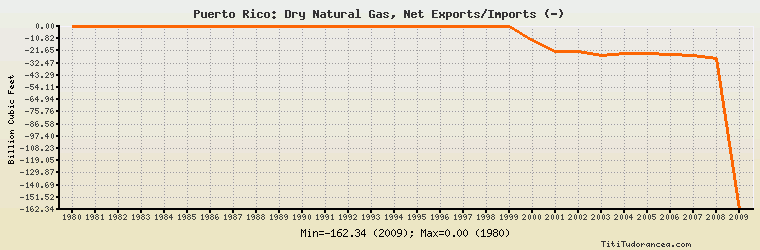
Puerto Rico: Dry Natural Gas, Net Exports/Imports (-)
Billion Cubic Feet
| Year | Puerto Rico | Change, percent | Puerto Rico, percent of Central & South America | Puerto Rico, percent of World |
| 1980 | 0.000 | N/A | 0.00% | N/A |
| 1981 | 0.000 | 0.000% | 0.00% | N/A |
| 1982 | 0.000 | 0.000% | 0.00% | N/A |
| 1983 | 0.000 | 0.000% | 0.00% | N/A |
| 1984 | 0.000 | 0.000% | - | N/A |
| 1985 | 0.000 | 0.000% | - | N/A |
| 1986 | 0.000 | 0.000% | - | N/A |
| 1987 | 0.000 | 0.000% | 0.00% | N/A |
| 1988 | 0.000 | 0.000% | 0.00% | N/A |
| 1989 | 0.000 | 0.000% | - | N/A |
| 1990 | 0.000 | 0.000% | 0.00% | N/A |
| 1991 | 0.000 | 0.000% | 0.00% | N/A |
| 1992 | 0.000 | 0.000% | 0.00% | N/A |
| 1993 | 0.000 | 0.000% | - | N/A |
| 1994 | 0.000 | 0.000% | - | N/A |
| 1995 | 0.000 | 0.000% | - | N/A |
| 1996 | 0.000 | 0.000% | - | N/A |
| 1997 | 0.000 | 0.000% | - | N/A |
| 1998 | 0.000 | 0.000% | - | N/A |
| 1999 | 0.000 | 0.000% | 0.00% | N/A |
| 2000 | -12.000 | 0.000% | -9.479% | N/A |
| 2001 | -22.000 | 83.333% | -18.868% | N/A |
| 2002 | -22.000 | 0.000% | -13.229% | N/A |
| 2003 | -26.000 | 18.182% | -6.773% | N/A |
| 2004 | -24.000 | -7.692% | -5.193% | N/A |
| 2005 | -24.000 | 0.000% | -5.184% | N/A |
| 2006 | -25.000 | 4.167% | -4.647% | N/A |
| 2007 | -26.000 | 4.000% | -4.264% | N/A |
| 2008 | -28.000 | 7.692% | -5.133% | N/A |
| 2009 | -162.340 | 479.786% | -27.628% | N/A |
Historical Energy Data about Puerto Rico
Total Oil Supply
Total Consumption of Petroleum Products
Oil and Petroleum Products, Net Exports/Imports (-)
Dry Natural Gas Consumption
Dry Natural Gas, Net Exports/Imports (-)
Total Coal Consumption
Coal, Net Exports/Imports (-)
Total Electricity Net Generation
Total Electricity Net Consumption
Electricity, Net Exports/Imports (-)
Total Conventional Thermal Electricity Net Generation
Hydroelectricity Net Generation
Total Primary Energy Production
Total Primary Energy Consumption
Total Carbon Dioxide Emissions from the Consumption of Energy
Population