| Business / Energy Data |
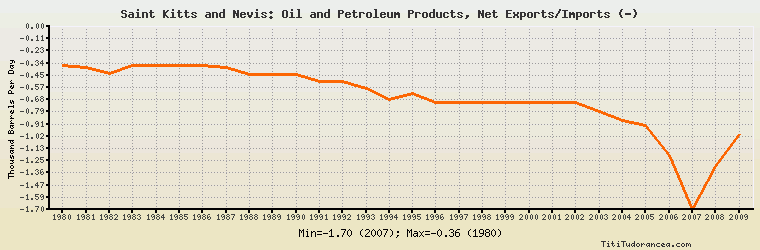
Saint Kitts and Nevis: Oil and Petroleum Products, Net Exports/Imports (-)
Thousand Barrels Per Day
| Year | Saint Kitts and Nevis | Change, percent | Saint Kitts and Nevis, percent of Central & South America | Saint Kitts and Nevis, percent of World |
| 1980 | -0.360 | N/A | -0.065% | N/A |
| 1981 | -0.380 | 5.556% | -0.126% | N/A |
| 1982 | -0.440 | 15.789% | -0.167% | N/A |
| 1983 | -0.360 | -18.182% | -0.082% | N/A |
| 1984 | -0.360 | 0.000% | -0.058% | N/A |
| 1985 | -0.363 | 0.833% | -0.053% | N/A |
| 1986 | -0.364 | 0.275% | -0.053% | N/A |
| 1987 | -0.384 | 5.495% | -0.075% | N/A |
| 1988 | -0.448 | 16.667% | -0.064% | N/A |
| 1989 | -0.449 | 0.223% | -0.061% | N/A |
| 1990 | -0.449 | 0.000% | -0.048% | N/A |
| 1991 | -0.511 | 13.808% | -0.046% | N/A |
| 1992 | -0.510 | -0.196% | -0.046% | N/A |
| 1993 | -0.576 | 12.941% | -0.047% | N/A |
| 1994 | -0.680 | 18.056% | -0.048% | N/A |
| 1995 | -0.622 | -8.529% | -0.038% | N/A |
| 1996 | -0.701 | 12.701% | -0.038% | N/A |
| 1997 | -0.703 | 0.285% | -0.033% | N/A |
| 1998 | -0.703 | 0.000% | -0.034% | N/A |
| 1999 | -0.703 | 0.000% | -0.039% | N/A |
| 2000 | -0.701 | -0.284% | -0.035% | N/A |
| 2001 | -0.703 | 0.285% | -0.037% | N/A |
| 2002 | -0.703 | 0.000% | -0.041% | N/A |
| 2003 | -0.789 | 12.233% | -0.053% | N/A |
| 2004 | -0.872 | 10.520% | -0.055% | N/A |
| 2005 | -0.918 | 5.275% | -0.056% | N/A |
| 2006 | -1.202 | 30.937% | -0.081% | N/A |
| 2007 | -1.699 | 41.348% | -0.126% | N/A |
| 2008 | -1.300 | -23.484% | -0.078% | N/A |
| 2009 | -1.000 | -23.077% | -0.065% | N/A |
Historical Energy Data about Saint Kitts and Nevis
Total Consumption of Petroleum Products
Oil and Petroleum Products, Net Exports/Imports (-)
Dry Natural Gas, Net Exports/Imports (-)
Coal, Net Exports/Imports (-)
Total Electricity Net Generation
Total Electricity Net Consumption
Electricity, Net Exports/Imports (-)
Total Conventional Thermal Electricity Net Generation
Total Primary Energy Consumption
Total Carbon Dioxide Emissions from the Consumption of Energy
Population