| Business / Energy Data |
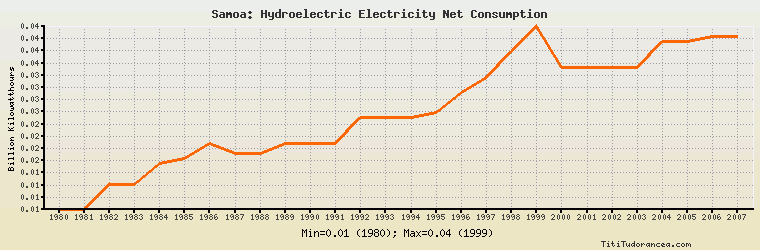
Samoa: Hydroelectric Electricity Net Consumption
Billion Kilowatthours
| Year | Samoa | Change, percent | Samoa, percent of Asia & Oceania | Samoa, percent of World |
| 1980 | 0.007 | N/A | 0.003% | 0.000% |
| 1981 | 0.007 | 0.000% | 0.003% | 0.000% |
| 1982 | 0.012 | 71.429% | 0.004% | 0.001% |
| 1983 | 0.012 | 0.000% | 0.004% | 0.001% |
| 1984 | 0.016 | 33.333% | 0.005% | 0.001% |
| 1985 | 0.017 | 6.250% | 0.005% | 0.001% |
| 1986 | 0.020 | 17.647% | 0.006% | 0.001% |
| 1987 | 0.018 | -10.000% | 0.006% | 0.001% |
| 1988 | 0.018 | 0.000% | 0.005% | 0.001% |
| 1989 | 0.020 | 11.111% | 0.005% | 0.001% |
| 1990 | 0.020 | 0.000% | 0.005% | 0.001% |
| 1991 | 0.020 | 0.000% | 0.005% | 0.001% |
| 1992 | 0.025 | 25.000% | 0.006% | 0.001% |
| 1993 | 0.025 | 0.000% | 0.006% | 0.001% |
| 1994 | 0.025 | 0.000% | 0.006% | 0.001% |
| 1995 | 0.026 | 4.000% | 0.005% | 0.001% |
| 1996 | 0.030 | 15.385% | 0.006% | 0.001% |
| 1997 | 0.033 | 10.000% | 0.007% | 0.001% |
| 1998 | 0.038 | 15.152% | 0.007% | 0.001% |
| 1999 | 0.043 | 13.158% | 0.008% | 0.002% |
| 2000 | 0.035 | -18.605% | 0.007% | 0.001% |
| 2001 | 0.035 | 0.000% | 0.006% | 0.001% |
| 2002 | 0.035 | 0.000% | 0.006% | 0.001% |
| 2003 | 0.035 | 0.000% | 0.006% | 0.001% |
| 2004 | 0.040 | 14.286% | 0.006% | 0.001% |
| 2005 | 0.040 | 0.000% | 0.005% | 0.001% |
| 2006 | 0.041 | 2.500% | 0.005% | 0.001% |
| 2007 | 0.041 | 0.000% | 0.005% | 0.001% |
| 2008 | N/A | N/A | N/A | N/A |
| 2009 | N/A | N/A | N/A | N/A |
| 2010 | N/A | N/A | N/A | N/A |
Historical Energy Data about Samoa
Total Consumption of Petroleum Products
Oil and Petroleum Products, Net Exports/Imports (-)
Dry Natural Gas, Net Exports/Imports (-)
Coal, Net Exports/Imports (-)
Total Electricity Net Generation
Total Electricity Net Consumption
Electricity, Net Exports/Imports (-)
Total Conventional Thermal Electricity Net Generation
Hydroelectricity Net Generation
Total Primary Energy Consumption
Total Carbon Dioxide Emissions from the Consumption of Energy
Population