| Business / Energy Data |
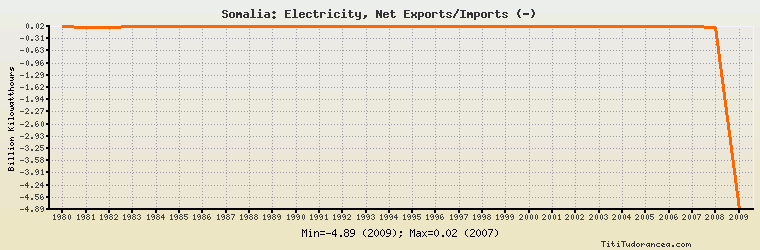
Somalia: Electricity, Net Exports/Imports (-)
Billion Kilowatthours
| Year | Somalia | Change, percent | Somalia, percent of Africa | Somalia, percent of World |
| 1980 | 0.008 | N/A | - | N/A |
| 1981 | 0.005 | -37.500% | - | N/A |
| 1982 | 0.006 | 20.000% | -66.667% | N/A |
| 1983 | 0.007 | 16.667% | -2.518% | N/A |
| 1984 | 0.009 | 28.571% | -17.647% | N/A |
| 1985 | 0.015 | 66.667% | - | N/A |
| 1986 | 0.017 | 13.333% | -14.783% | N/A |
| 1987 | 0.017 | 0.000% | -8.500% | N/A |
| 1988 | 0.017 | 0.000% | -6.343% | N/A |
| 1989 | 0.017 | 0.000% | -17.347% | N/A |
| 1990 | 0.017 | 0.000% | -3.484% | N/A |
| 1991 | 0.017 | 0.000% | -7.265% | N/A |
| 1992 | 0.017 | 0.000% | 11.486% | N/A |
| 1993 | 0.018 | 5.882% | -35.294% | N/A |
| 1994 | 0.018 | 0.000% | -14.286% | N/A |
| 1995 | 0.018 | 0.000% | 3.956% | N/A |
| 1996 | 0.018 | 0.000% | 1.015% | N/A |
| 1997 | 0.018 | 0.000% | 1.141% | N/A |
| 1998 | 0.018 | 0.000% | -0.510% | N/A |
| 1999 | 0.018 | 0.000% | -0.731% | N/A |
| 2000 | 0.016 | -11.111% | -0.426% | N/A |
| 2001 | 0.017 | 6.250% | -0.618% | N/A |
| 2002 | 0.018 | 5.882% | -0.991% | N/A |
| 2003 | 0.018 | 0.000% | -0.574% | N/A |
| 2004 | 0.018 | 0.000% | -1.097% | N/A |
| 2005 | 0.019 | 5.556% | -0.859% | N/A |
| 2006 | 0.019 | 0.000% | -0.468% | N/A |
| 2007 | 0.020 | 5.263% | -0.436% | N/A |
| 2008 | 0.000 | -100.000% | 0.00% | N/A |
| 2009 | -4.892 | 0.000% | 113.503% | N/A |
Historical Energy Data about Somalia
Total Oil Supply
Total Consumption of Petroleum Products
Oil and Petroleum Products, Net Exports/Imports (-)
Dry Natural Gas, Net Exports/Imports (-)
Proved Reserves of Natural Gas
Coal, Net Exports/Imports (-)
Total Electricity Net Generation
Total Electricity Net Consumption
Electricity, Net Exports/Imports (-)
Total Conventional Thermal Electricity Net Generation
Total Primary Energy Consumption
Total Carbon Dioxide Emissions from the Consumption of Energy
Population