| Business / Energy Data |
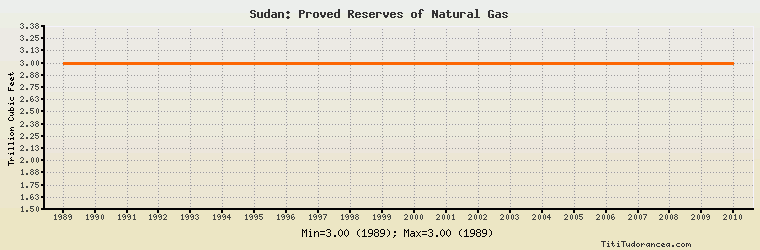
Sudan: Proved Reserves of Natural Gas
Trillion Cubic Feet
| Year | Sudan | Change, percent | Sudan, percent of Africa | Sudan, percent of World |
| 1980 | N/A | N/A | N/A | N/A |
| 1981 | N/A | N/A | N/A | N/A |
| 1982 | N/A | N/A | N/A | N/A |
| 1983 | N/A | N/A | N/A | N/A |
| 1984 | N/A | N/A | N/A | N/A |
| 1985 | N/A | N/A | N/A | N/A |
| 1986 | N/A | N/A | N/A | N/A |
| 1987 | N/A | N/A | N/A | N/A |
| 1988 | N/A | N/A | N/A | N/A |
| 1989 | 3.000 | N/A | 1.167% | 0.076% |
| 1990 | 3.000 | 0.000% | 1.105% | 0.075% |
| 1991 | 3.000 | 0.000% | 1.035% | 0.071% |
| 1992 | 3.000 | 0.000% | 0.965% | 0.114% |
| 1993 | 3.000 | 0.000% | 0.863% | 0.102% |
| 1994 | 3.000 | 0.000% | 0.873% | 0.099% |
| 1995 | 3.000 | 0.000% | 0.878% | 0.100% |
| 1996 | 3.000 | 0.000% | 0.897% | 0.101% |
| 1997 | 3.000 | 0.000% | 0.913% | 0.061% |
| 1998 | 3.000 | 0.000% | 0.860% | 0.059% |
| 1999 | 3.000 | 0.000% | 0.830% | 0.058% |
| 2000 | 3.000 | 0.000% | 0.761% | 0.058% |
| 2001 | 3.000 | 0.000% | 0.761% | 0.057% |
| 2002 | 3.000 | 0.000% | 0.759% | 0.055% |
| 2003 | 3.000 | 0.000% | 0.717% | 0.054% |
| 2004 | 3.000 | 0.000% | 0.661% | 0.049% |
| 2005 | 3.000 | 0.000% | 0.629% | 0.050% |
| 2006 | 3.000 | 0.000% | 0.617% | 0.049% |
| 2007 | 3.000 | 0.000% | 0.618% | 0.048% |
| 2008 | 3.000 | 0.000% | 0.611% | 0.048% |
| 2009 | 3.000 | 0.000% | 0.606% | 0.048% |
| 2010 | 3.000 | 0.000% | 0.605% | 0.045% |
Historical Energy Data about Sudan
Total Oil Supply
Total Consumption of Petroleum Products
Oil and Petroleum Products, Net Exports/Imports (-)
Production of Crude Oil including Lease Condensate
Crude Oil Proved Reserves
Dry Natural Gas, Net Exports/Imports (-)
Proved Reserves of Natural Gas
Coal, Net Exports/Imports (-)
Total Electricity Net Generation
Total Electricity Net Consumption
Electricity, Net Exports/Imports (-)
Total Conventional Thermal Electricity Net Generation
Hydroelectricity Net Generation
Total Primary Energy Production
Total Primary Energy Consumption
Total Carbon Dioxide Emissions from the Consumption of Energy
Population